> ## Documentation Index
> Fetch the complete documentation index at: https://wb-21fd5541-hivemind-1-0-8-one-pager.mintlify.site/llms.txt
> Use this file to discover all available pages before exploring further.
# W&B Mobile App (iOS)
> Track training runs, review console logs, view line plots and system metrics, and explore W&B Models projects from your iPhone or iPad.
Latest version: 26.24 (released September 8, 2026). [App Store release notes](https://apps.apple.com/us/app/6755162576).
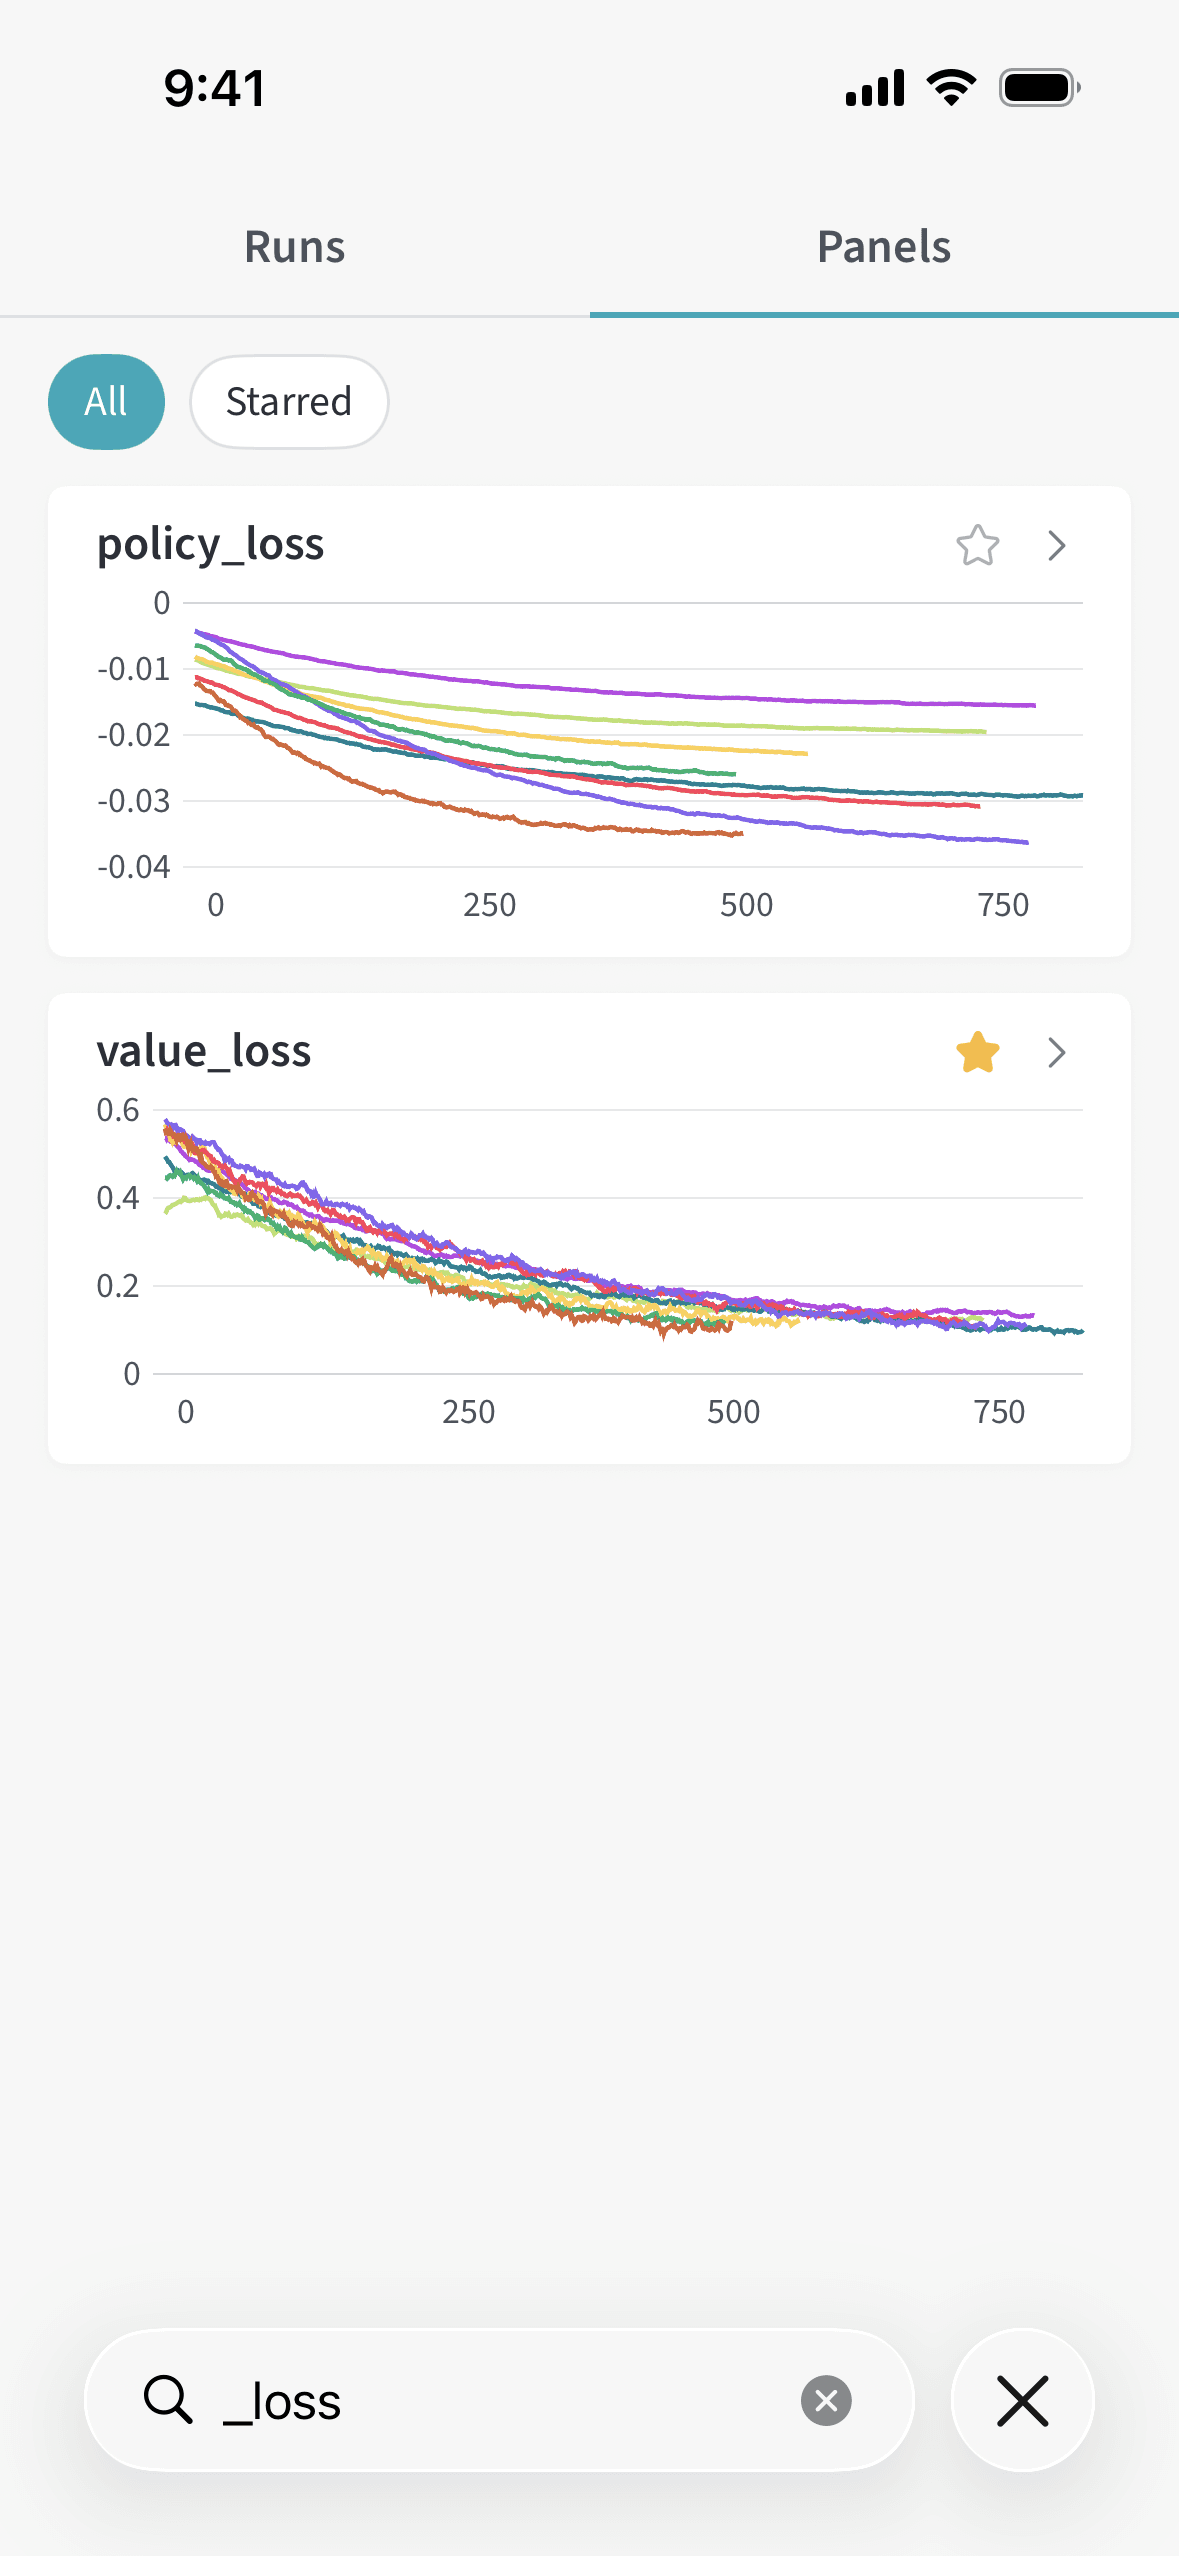
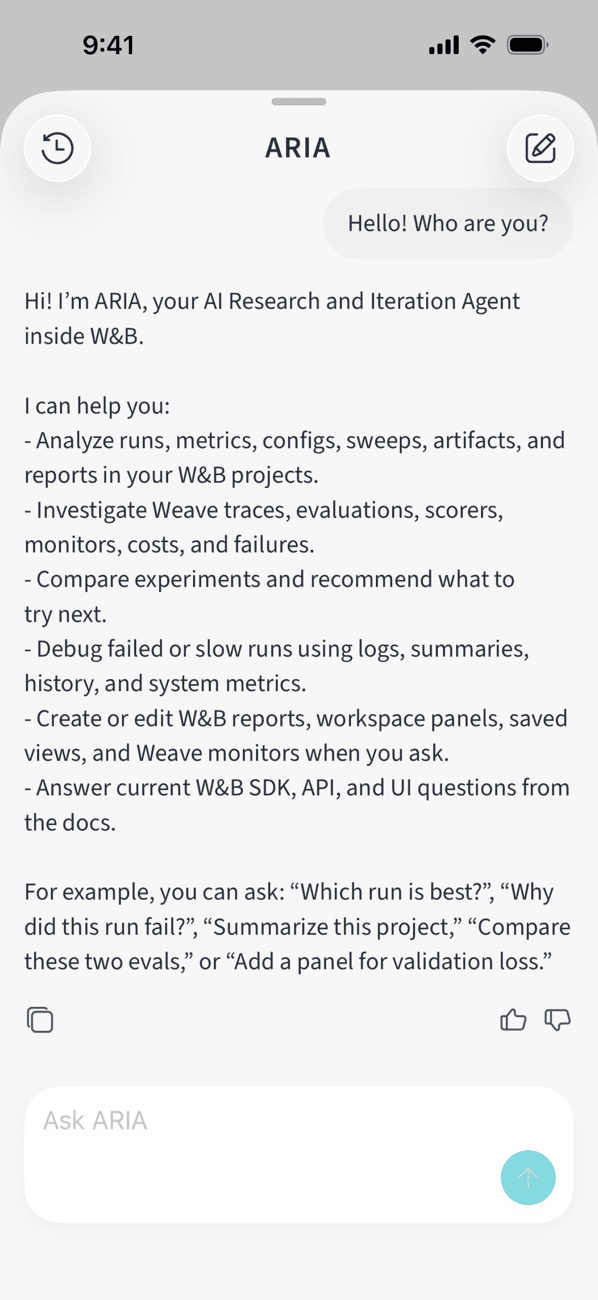
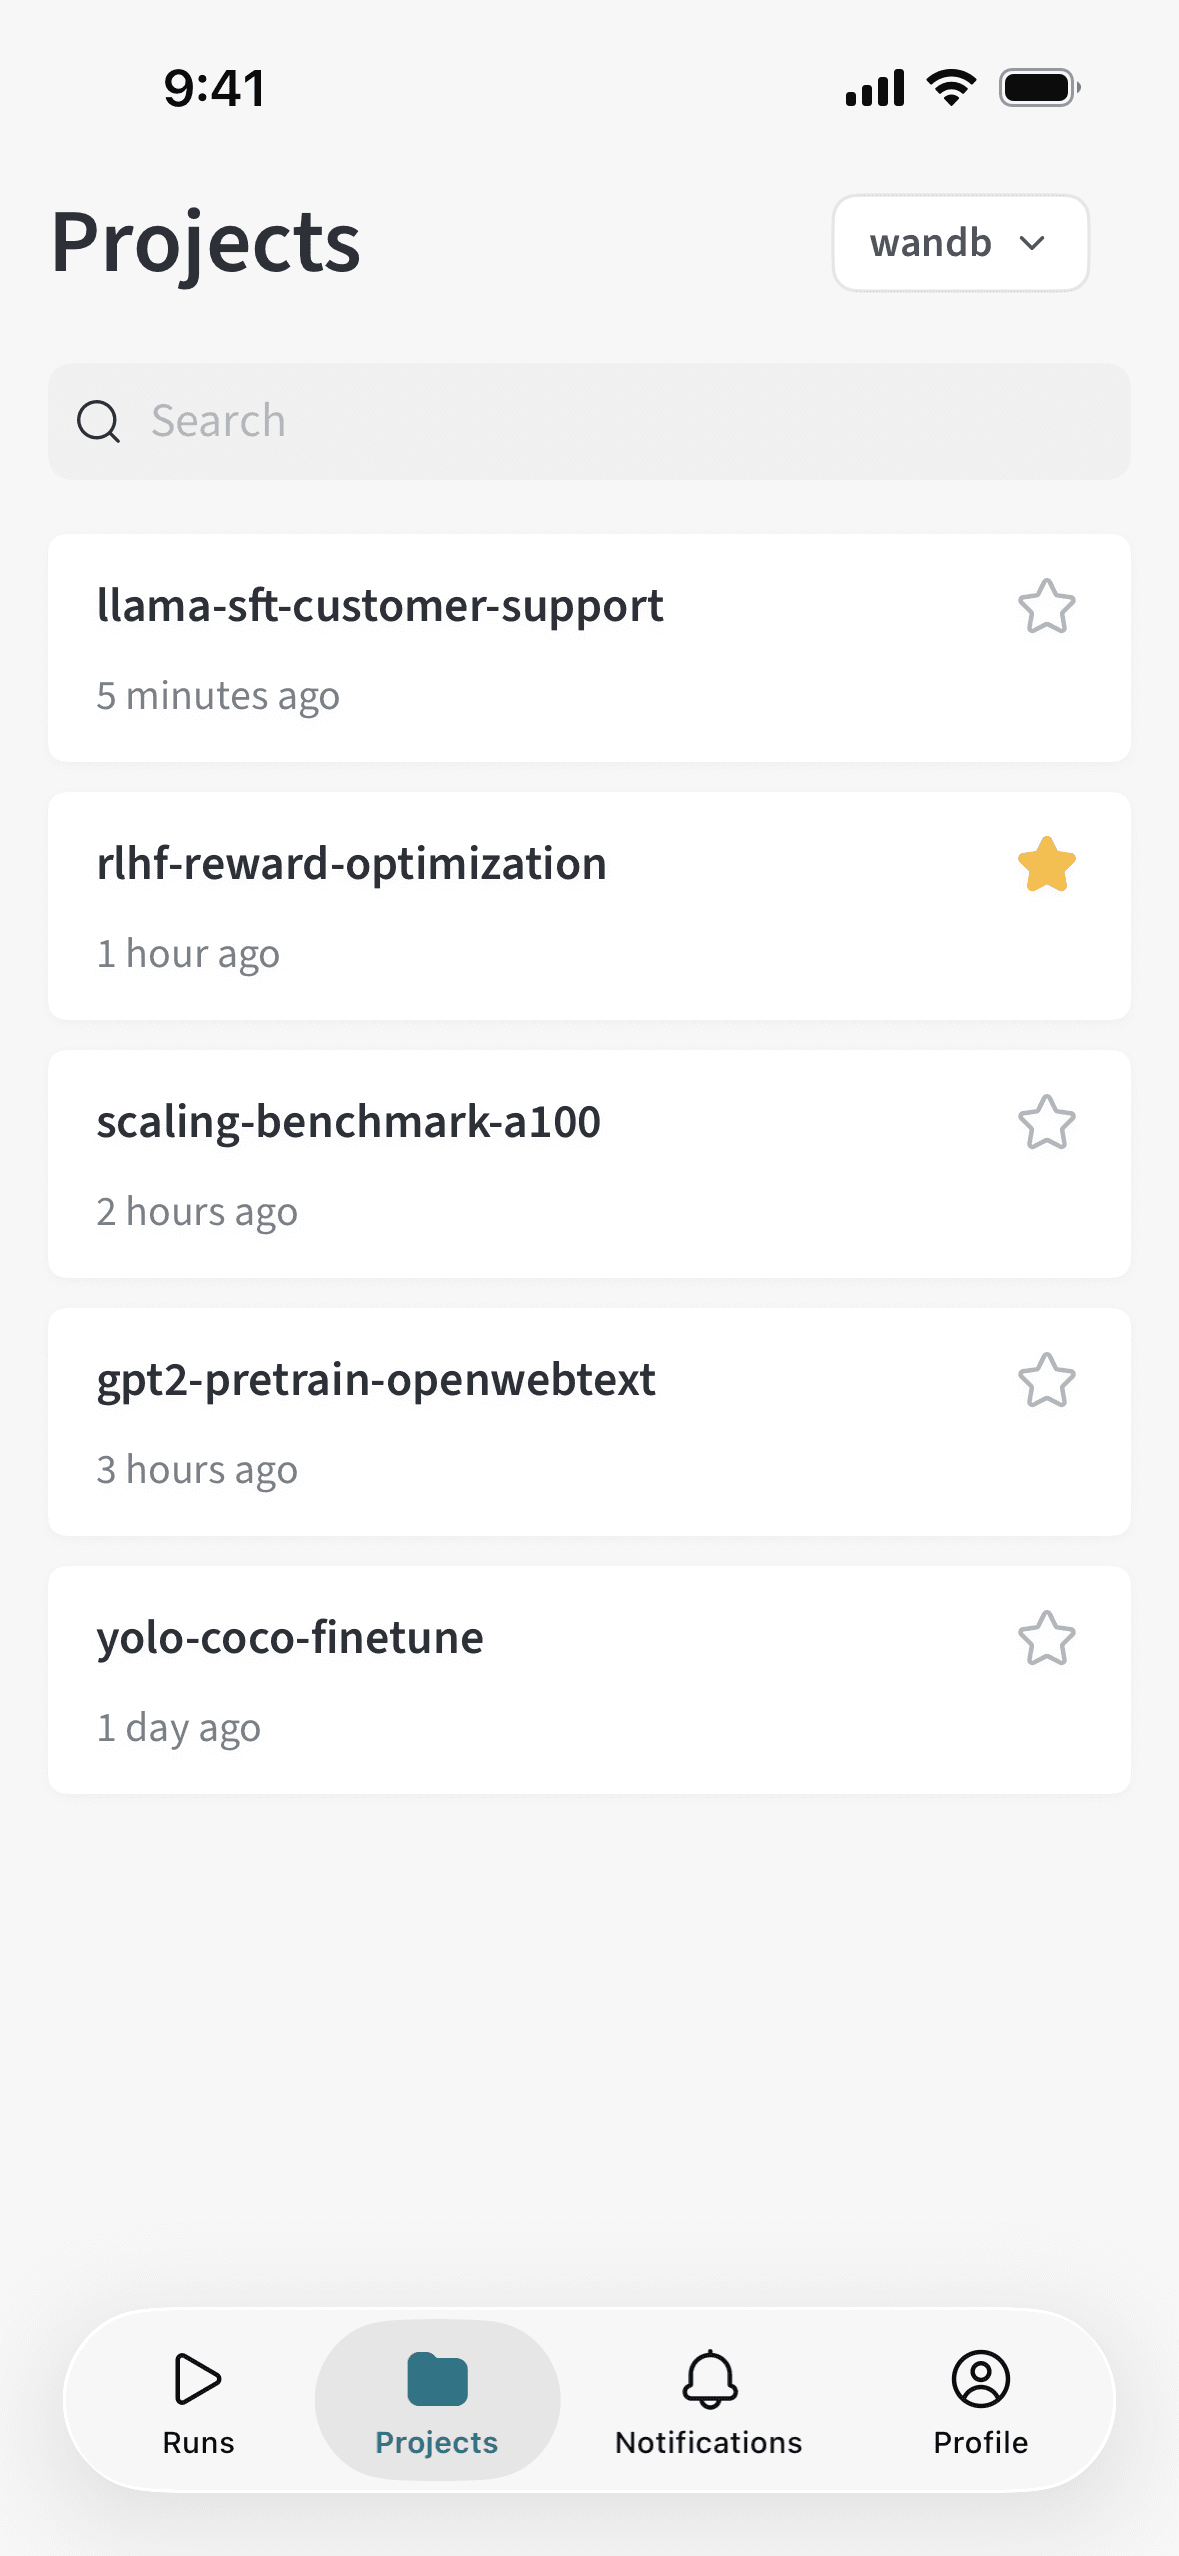
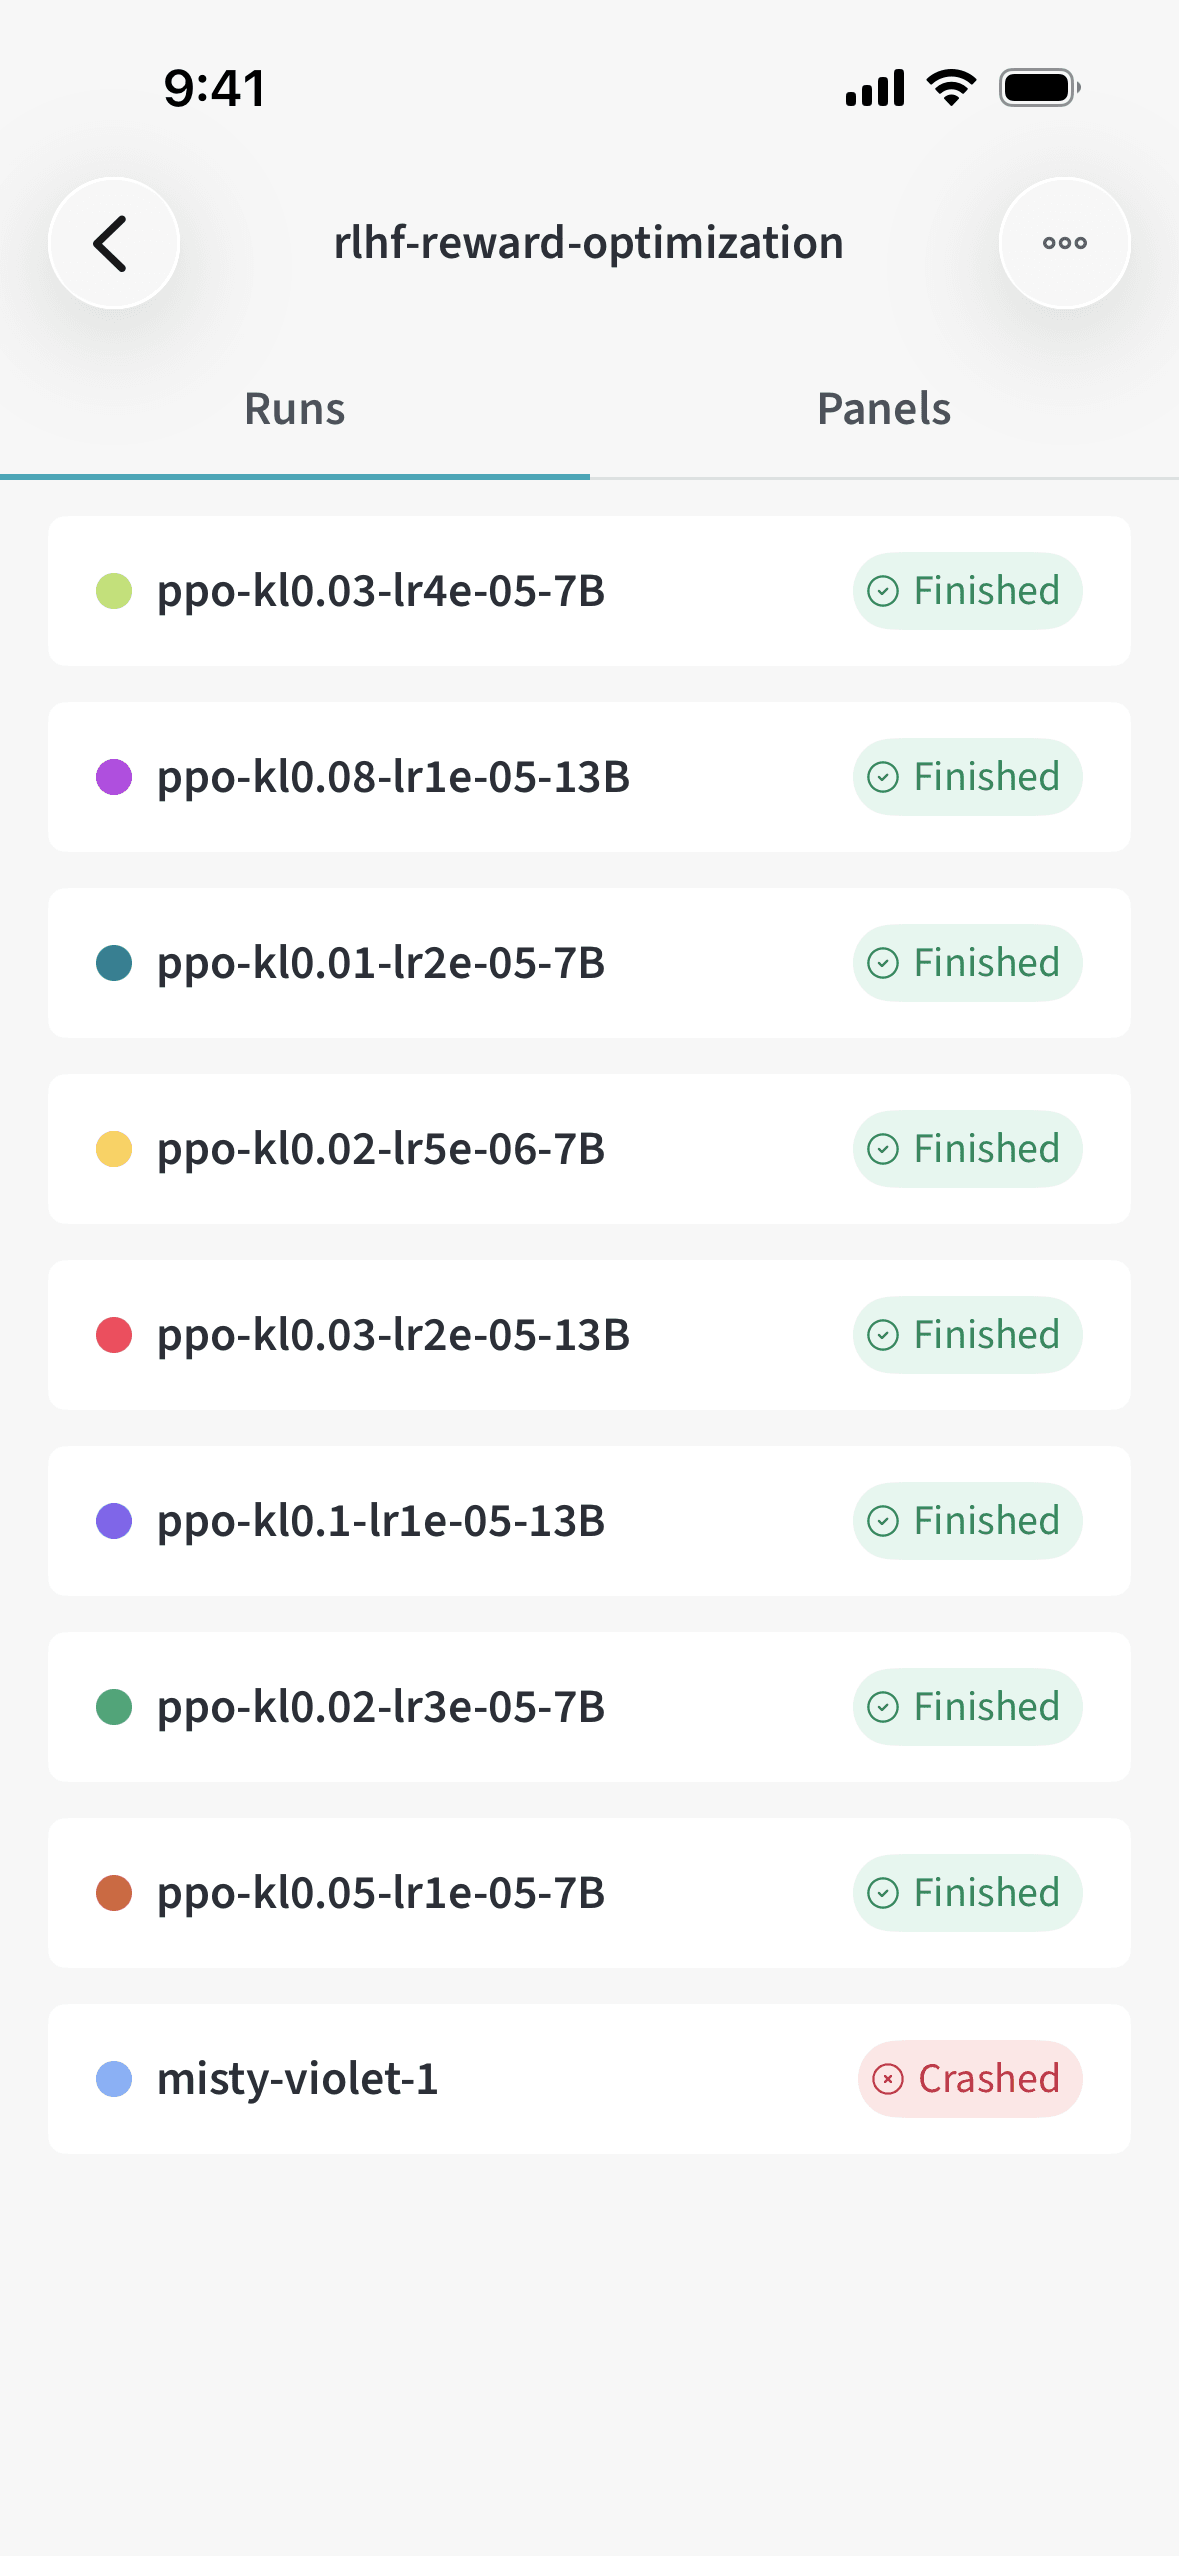 The W\&B Mobile App for iOS keeps you connected to your W\&B Models projects wherever you go. Use it on your iPhone or iPad to track training runs and read run logs in real time, view line plots and system metrics, explore project histories, and follow your team's progress so you can monitor experiments without opening your laptop. This page describes the app's features and shows you how to set up notifications.
The mobile app is available for [Multi-tenant Cloud](/platform/hosting/hosting-options/multi_tenant_cloud) accounts, and in preview for [Dedicated Cloud](/platform/hosting/hosting-options/dedicated-cloud) accounts, by invitation only. To request access for your organization, contact [support](mailto:support@wandb.com) or your AISE. The mobile app isn't available for [Self-Managed](/platform/hosting/hosting-options/self-managed) deployments.
## Download W\&B Mobile
Install the app from the App Store to get started.
## Log in
Follow these steps to sign in to W\&B on iOS. How you log in depends on the deployment your W\&B account belongs to. Select your deployment type to continue.
You can't create a W\&B account from the mobile app. Visit [wandb.ai](https://wandb.ai) on a desktop browser and click **Sign up**.
To log in, follow these steps:
1. Open the app, then tap **Log in**.
2. Log in with the same credentials you use for W\&B in your browser.
Multi-tenant Cloud doesn't use login codes, so the **Log in on mobile** menu item doesn't appear in W\&B.
Access to W\&B Dedicated Cloud from a mobile device is available in preview by invitation only.
To authenticate to a Dedicated Cloud instance, generate a code in W\&B App on your computer, then scan it with your mobile device. Have both devices available before you begin.
1. On your computer, sign in to W\&B.
2. Select your profile image in the upper-right corner, then select **Log in on mobile**. If this option is unavailable, your organization is not enrolled in the preview. To request access for your organization, contact [support](mailto:support@wandb.com) or your AISE.
3. In the **Log in on mobile** dialog, click **Generate login code**. W\&B displays the login code as a QR code and adds an API key named **W\&B iOS** to your [user settings](/platform/app/settings-page/user-settings#api-keys). If W\&B can't generate a key, an error appears in the dialog. If your organization restricts who can create API keys, ask your organization admin for help.
4. On your iPhone or iPad, open the app, then tap **Log in to Dedicated Cloud**. If prompted, allow the app to use your camera.
5. Point your device's camera at the QR code. The app logs you in to your Dedicated Cloud instance and closes the scanner.
6. On your computer, click **Done** to close the dialog.
Treat a login code as sensitive information because it grants access to your W\&B account. Protect it the same way you protect an API key or password. Don't take a screenshot of the code, save it, or share it. Close the dialog when you finish logging in. If a code might have been exposed, [delete the API key](/platform/app/settings-page/user-settings#delete-an-api-key) immediately, then generate a new login code.
Keep the following in mind when you log in to Dedicated Cloud:
* Each login code you generate adds another **W\&B iOS** API key to your user settings, each with its own key ID. Because the keys share a name, rename a key to differentiate it, such as by including which device uses it. In your user settings, open the key's **action ()** menu, then click **Edit**.
* A **W\&B iOS** key stays valid until you delete it. Deleting a key revokes access for the device that scanned the matching login code.
* Logging in to Dedicated Cloud replaces the credentials of any account you were previously logged in to.
* If you don't see **Log in to Dedicated Cloud** in the app, then confirm that your organization has access to the preview.
## Features
The following features are available in the mobile app.
* **Explore projects**: Browse and search across your W\&B projects.
* **Full project history**: Metric charts on project panels include data from *all runs* in the project, not only the latest run.
* **Star projects**: See your most important projects at a glance. Tap the star icon next to a project to star it. To filter the list to only starred projects, tap the **Starred** tab at the top of the list.
* **Track experiments**: View run status, metrics, and line plots for your experiments in real time.
* **Hide and show runs**: On a project's **Runs** tab, tap the **visibility ()** icon on a run to hide it. Hidden runs stay in the runs list with a **hidden ()** icon, so you can tap the icon again to show the run. Charts on the project's **Panels** tab plot only the runs that are visible. The app remembers which runs you hid in each project between launches.
* **Live updates**: Charts refresh as new data arrives. The **Runs** tab and project run lists update automatically when new runs start.
* **Run overview tab**: On each run, open the **Overview** tab for a dedicated summary of run details alongside metrics and logs. View the full run configuration and summary, including nested objects and arrays. Long config values wrap to multiple lines. Long-press a configuration value to copy it.
* **View system metrics**: On each run, open the **Metrics** tab to see how your hardware behaved during training. W\&B automatically logs [metrics](/models/ref/python/experiments/system-metrics) such as GPU utilization, CPU usage, memory, disk I/O, and network traffic. System metrics appear in a collapsible **System** section alongside your logged metrics. Each metric displays as a line chart with the same tooltip and search behavior as other metrics on the tab.
* **Mobile-optimized panel grouping**: Panels are automatically grouped by name into collapsible sections. You can collapse the ungrouped metrics section to focus on named sections. Sections are a single level (not nested), and grouping follows the same rules as [workspace panels](/models/app/features/panels) in the W\&B web app, so the layout stays consistent when you move between desktop and your phone.
* **Star panels**: See your most important panels at a glance. When viewing a run or a project, tap the star icon at the top of a panel to star it. To filter the list to only starred panels, tap the **Starred** tab at the top of the list.
* **Star metrics**: When viewing an important metric in detail view, tap the star icon to star it. Run cards on the **Runs** page prioritize your starred metrics when choosing which metric to display.
* **Search panels**: When viewing a run or a project, use the **panel search** field at the bottom of the screen to filter which runs appear in each chart. You can search with [RE2 syntax](https://github.com/google/re2/wiki/Syntax) to match patterns in run names.
* **Chart tooltips**: On line charts, tooltips show metric values with up to four decimal places so you can read small changes accurately.
* **Zoom charts**: Pinch vertically or horizontally on a line chart to zoom in on either axis, or double-tap to step through zoom levels. The Y-axis rescales automatically to fit the visible portion of the curve, so small variations late in a run stay readable.
* **View image metrics**: Images you log to a run appear on the **Metrics** tab as panels you can interact with. Tap to view a single image, then pinch to zoom or drag to pan. See [View image metrics](#view-image-metrics).
* **Change line plot settings**: Switch a line plot to a logarithmic Y-axis and apply smoothing, for a single plot or for every plot in a run or project. See [Change line plot settings](#change-line-plot-settings).
* **Filter metrics**: Use the metric filter controls to narrow which metrics appear, so you can focus on the ones that matter.
* **Stop runs**: When viewing an in-progress run, tap the **action ()** menu, then tap **Stop run**.
* **View console logs**: Read [logs](/models/runs/view-logged-runs#logs) from active or completed runs, or download them once a run finishes. Colors from ANSI escape codes in your script output render faithfully and adapt to light and dark mode. The app polls active runs for new log lines every 5 seconds. Polling stops once a run finishes or crashes, which saves network and battery use. Even for runs with hundreds of thousands of log lines, the most recent output appears immediately, and older lines load in the background. Scrolling and log search stay responsive even for large outputs.
* **Switch teams**: Use the **team picker** to change teams.
* **Stay informed**: Get updates on your experiments without opening your laptop using notifications. **Remove alerts** you no longer need from the **Notifications** tab by swiping them away.
* **Chat with ARIA**: Use ARIA in the mobile app to ask questions, analyze runs, and take action without leaving your phone.
## View image metrics
Images you log to a run with [`wandb.Image`](/models/track/log/media) appear on the run's **Metrics** tab, where each image metric has its own panel alongside your line plots. The following actions are available for image metrics.
* **Scrub through steps**: Drag the step slider below the images to move through the steps the metric logged. When the metric logged only one step, the slider doesn't appear.
* **Jump to a step**: Tap the step value next to the slider, enter a step, then tap **Go to step**. The sheet shows the range of steps the metric logged, and your entry snaps to the nearest logged step.
* **Compare images within a step**: When a step logs more than one image, the panel arranges them in a grid that you swipe horizontally to page through. Dots below the grid show which page you're viewing.
* **View an image full screen**: Tap the panel to open the detail view, then tap an image. Pinch to zoom and drag to pan, and swipe to move to the next or previous image in the step.
* **Star image metrics**: Tap the star icon on the panel to star an image metric, the same as other panels.
## Change line plot settings
Line plot settings control how the app draws a line plot. Open the settings in one of the following ways:
* On a run's **Metrics** tab or a project's **Panels** tab, tap the **line plot settings** button next to the metric filter. Changes apply to every line plot in that run or project.
* On a single chart's detail screen, tap the **line plot settings** button in the toolbar. Changes apply only to that plot.
The settings sheet names its scope below the title, so you can confirm what a change affects before you make it. The following settings are available.
* **Log scale (Y)**: Draw the Y-axis logarithmically to compare a metric across orders of magnitude. A logarithmic axis can't plot zero or negative values. If a plot has no positive values to draw, the app replaces the chart with the message "No positive values to plot on a log scale".
* **Smoothing**: Apply [time-weighted exponential moving average (TWEMA)](/models/app/features/panels/line-plot/smoothing#time-weighted-exponential-moving-average-twema-smoothing-default) smoothing, from `0` (off) to `0.99`. This algorithm is also the default in the W\&B web app.
To restore the defaults, tap **Reset this line plot** or **Reset to defaults**, depending on the scope you opened the settings from.
The app saves your line plot settings between launches. When you change a setting on one plot, that setting also applies to plots of the same metric in your other runs and projects.
## Chat with ARIA
ARIA (AI Research & Iteration Agent) is your personalized research assistant in W\&B. Use ARIA for tasks such as analyzing and running experiments, explaining results, identifying patterns across runs, recommending next steps, and building visualizations and reports.
To chat with ARIA, tap
The W\&B Mobile App for iOS keeps you connected to your W\&B Models projects wherever you go. Use it on your iPhone or iPad to track training runs and read run logs in real time, view line plots and system metrics, explore project histories, and follow your team's progress so you can monitor experiments without opening your laptop. This page describes the app's features and shows you how to set up notifications.
The mobile app is available for [Multi-tenant Cloud](/platform/hosting/hosting-options/multi_tenant_cloud) accounts, and in preview for [Dedicated Cloud](/platform/hosting/hosting-options/dedicated-cloud) accounts, by invitation only. To request access for your organization, contact [support](mailto:support@wandb.com) or your AISE. The mobile app isn't available for [Self-Managed](/platform/hosting/hosting-options/self-managed) deployments.
## Download W\&B Mobile
Install the app from the App Store to get started.
## Log in
Follow these steps to sign in to W\&B on iOS. How you log in depends on the deployment your W\&B account belongs to. Select your deployment type to continue.
You can't create a W\&B account from the mobile app. Visit [wandb.ai](https://wandb.ai) on a desktop browser and click **Sign up**.
To log in, follow these steps:
1. Open the app, then tap **Log in**.
2. Log in with the same credentials you use for W\&B in your browser.
Multi-tenant Cloud doesn't use login codes, so the **Log in on mobile** menu item doesn't appear in W\&B.
Access to W\&B Dedicated Cloud from a mobile device is available in preview by invitation only.
To authenticate to a Dedicated Cloud instance, generate a code in W\&B App on your computer, then scan it with your mobile device. Have both devices available before you begin.
1. On your computer, sign in to W\&B.
2. Select your profile image in the upper-right corner, then select **Log in on mobile**. If this option is unavailable, your organization is not enrolled in the preview. To request access for your organization, contact [support](mailto:support@wandb.com) or your AISE.
3. In the **Log in on mobile** dialog, click **Generate login code**. W\&B displays the login code as a QR code and adds an API key named **W\&B iOS** to your [user settings](/platform/app/settings-page/user-settings#api-keys). If W\&B can't generate a key, an error appears in the dialog. If your organization restricts who can create API keys, ask your organization admin for help.
4. On your iPhone or iPad, open the app, then tap **Log in to Dedicated Cloud**. If prompted, allow the app to use your camera.
5. Point your device's camera at the QR code. The app logs you in to your Dedicated Cloud instance and closes the scanner.
6. On your computer, click **Done** to close the dialog.
Treat a login code as sensitive information because it grants access to your W\&B account. Protect it the same way you protect an API key or password. Don't take a screenshot of the code, save it, or share it. Close the dialog when you finish logging in. If a code might have been exposed, [delete the API key](/platform/app/settings-page/user-settings#delete-an-api-key) immediately, then generate a new login code.
Keep the following in mind when you log in to Dedicated Cloud:
* Each login code you generate adds another **W\&B iOS** API key to your user settings, each with its own key ID. Because the keys share a name, rename a key to differentiate it, such as by including which device uses it. In your user settings, open the key's **action ()** menu, then click **Edit**.
* A **W\&B iOS** key stays valid until you delete it. Deleting a key revokes access for the device that scanned the matching login code.
* Logging in to Dedicated Cloud replaces the credentials of any account you were previously logged in to.
* If you don't see **Log in to Dedicated Cloud** in the app, then confirm that your organization has access to the preview.
## Features
The following features are available in the mobile app.
* **Explore projects**: Browse and search across your W\&B projects.
* **Full project history**: Metric charts on project panels include data from *all runs* in the project, not only the latest run.
* **Star projects**: See your most important projects at a glance. Tap the star icon next to a project to star it. To filter the list to only starred projects, tap the **Starred** tab at the top of the list.
* **Track experiments**: View run status, metrics, and line plots for your experiments in real time.
* **Hide and show runs**: On a project's **Runs** tab, tap the **visibility ()** icon on a run to hide it. Hidden runs stay in the runs list with a **hidden ()** icon, so you can tap the icon again to show the run. Charts on the project's **Panels** tab plot only the runs that are visible. The app remembers which runs you hid in each project between launches.
* **Live updates**: Charts refresh as new data arrives. The **Runs** tab and project run lists update automatically when new runs start.
* **Run overview tab**: On each run, open the **Overview** tab for a dedicated summary of run details alongside metrics and logs. View the full run configuration and summary, including nested objects and arrays. Long config values wrap to multiple lines. Long-press a configuration value to copy it.
* **View system metrics**: On each run, open the **Metrics** tab to see how your hardware behaved during training. W\&B automatically logs [metrics](/models/ref/python/experiments/system-metrics) such as GPU utilization, CPU usage, memory, disk I/O, and network traffic. System metrics appear in a collapsible **System** section alongside your logged metrics. Each metric displays as a line chart with the same tooltip and search behavior as other metrics on the tab.
* **Mobile-optimized panel grouping**: Panels are automatically grouped by name into collapsible sections. You can collapse the ungrouped metrics section to focus on named sections. Sections are a single level (not nested), and grouping follows the same rules as [workspace panels](/models/app/features/panels) in the W\&B web app, so the layout stays consistent when you move between desktop and your phone.
* **Star panels**: See your most important panels at a glance. When viewing a run or a project, tap the star icon at the top of a panel to star it. To filter the list to only starred panels, tap the **Starred** tab at the top of the list.
* **Star metrics**: When viewing an important metric in detail view, tap the star icon to star it. Run cards on the **Runs** page prioritize your starred metrics when choosing which metric to display.
* **Search panels**: When viewing a run or a project, use the **panel search** field at the bottom of the screen to filter which runs appear in each chart. You can search with [RE2 syntax](https://github.com/google/re2/wiki/Syntax) to match patterns in run names.
* **Chart tooltips**: On line charts, tooltips show metric values with up to four decimal places so you can read small changes accurately.
* **Zoom charts**: Pinch vertically or horizontally on a line chart to zoom in on either axis, or double-tap to step through zoom levels. The Y-axis rescales automatically to fit the visible portion of the curve, so small variations late in a run stay readable.
* **View image metrics**: Images you log to a run appear on the **Metrics** tab as panels you can interact with. Tap to view a single image, then pinch to zoom or drag to pan. See [View image metrics](#view-image-metrics).
* **Change line plot settings**: Switch a line plot to a logarithmic Y-axis and apply smoothing, for a single plot or for every plot in a run or project. See [Change line plot settings](#change-line-plot-settings).
* **Filter metrics**: Use the metric filter controls to narrow which metrics appear, so you can focus on the ones that matter.
* **Stop runs**: When viewing an in-progress run, tap the **action ()** menu, then tap **Stop run**.
* **View console logs**: Read [logs](/models/runs/view-logged-runs#logs) from active or completed runs, or download them once a run finishes. Colors from ANSI escape codes in your script output render faithfully and adapt to light and dark mode. The app polls active runs for new log lines every 5 seconds. Polling stops once a run finishes or crashes, which saves network and battery use. Even for runs with hundreds of thousands of log lines, the most recent output appears immediately, and older lines load in the background. Scrolling and log search stay responsive even for large outputs.
* **Switch teams**: Use the **team picker** to change teams.
* **Stay informed**: Get updates on your experiments without opening your laptop using notifications. **Remove alerts** you no longer need from the **Notifications** tab by swiping them away.
* **Chat with ARIA**: Use ARIA in the mobile app to ask questions, analyze runs, and take action without leaving your phone.
## View image metrics
Images you log to a run with [`wandb.Image`](/models/track/log/media) appear on the run's **Metrics** tab, where each image metric has its own panel alongside your line plots. The following actions are available for image metrics.
* **Scrub through steps**: Drag the step slider below the images to move through the steps the metric logged. When the metric logged only one step, the slider doesn't appear.
* **Jump to a step**: Tap the step value next to the slider, enter a step, then tap **Go to step**. The sheet shows the range of steps the metric logged, and your entry snaps to the nearest logged step.
* **Compare images within a step**: When a step logs more than one image, the panel arranges them in a grid that you swipe horizontally to page through. Dots below the grid show which page you're viewing.
* **View an image full screen**: Tap the panel to open the detail view, then tap an image. Pinch to zoom and drag to pan, and swipe to move to the next or previous image in the step.
* **Star image metrics**: Tap the star icon on the panel to star an image metric, the same as other panels.
## Change line plot settings
Line plot settings control how the app draws a line plot. Open the settings in one of the following ways:
* On a run's **Metrics** tab or a project's **Panels** tab, tap the **line plot settings** button next to the metric filter. Changes apply to every line plot in that run or project.
* On a single chart's detail screen, tap the **line plot settings** button in the toolbar. Changes apply only to that plot.
The settings sheet names its scope below the title, so you can confirm what a change affects before you make it. The following settings are available.
* **Log scale (Y)**: Draw the Y-axis logarithmically to compare a metric across orders of magnitude. A logarithmic axis can't plot zero or negative values. If a plot has no positive values to draw, the app replaces the chart with the message "No positive values to plot on a log scale".
* **Smoothing**: Apply [time-weighted exponential moving average (TWEMA)](/models/app/features/panels/line-plot/smoothing#time-weighted-exponential-moving-average-twema-smoothing-default) smoothing, from `0` (off) to `0.99`. This algorithm is also the default in the W\&B web app.
To restore the defaults, tap **Reset this line plot** or **Reset to defaults**, depending on the scope you opened the settings from.
The app saves your line plot settings between launches. When you change a setting on one plot, that setting also applies to plots of the same metric in your other runs and projects.
## Chat with ARIA
ARIA (AI Research & Iteration Agent) is your personalized research assistant in W\&B. Use ARIA for tasks such as analyzing and running experiments, explaining results, identifying patterns across runs, recommending next steps, and building visualizations and reports.
To chat with ARIA, tap 
 in the bottom navigation.
In the mobile app, ARIA keeps context across multi-turn chats and shows reasoning and action details while it works.
* **Project context**: ARIA automatically detects which project you're viewing in the app and uses it as context, so answers come with the right project already in mind. You can also reference projects and runs directly in your chat messages.
* **Rich replies**: Replies render with rich Markdown formatting, including tables, headings, lists, and inline code. When ARIA asks questions, they render as an interactive view directly in the conversation.
* **Visible actions**: Shell steps show when ARIA takes an action, such as creating a panel, filtering runs, creating and running Python scripts, and more.
* **Chat history**: Long-press a chat in your chat history to preview, rename, or delete it. Chat history is kept in sync so you can move seamlessly between the web app and mobile app.
For a full overview of ARIA capabilities, see [ARIA overview](/aria/overview).
## Set up notifications
Configure notifications to receive updates about your experiments on your mobile device.
in the bottom navigation.
In the mobile app, ARIA keeps context across multi-turn chats and shows reasoning and action details while it works.
* **Project context**: ARIA automatically detects which project you're viewing in the app and uses it as context, so answers come with the right project already in mind. You can also reference projects and runs directly in your chat messages.
* **Rich replies**: Replies render with rich Markdown formatting, including tables, headings, lists, and inline code. When ARIA asks questions, they render as an interactive view directly in the conversation.
* **Visible actions**: Shell steps show when ARIA takes an action, such as creating a panel, filtering runs, creating and running Python scripts, and more.
* **Chat history**: Long-press a chat in your chat history to preview, rename, or delete it. Chat history is kept in sync so you can move seamlessly between the web app and mobile app.
For a full overview of ARIA capabilities, see [ARIA overview](/aria/overview).
## Set up notifications
Configure notifications to receive updates about your experiments on your mobile device.
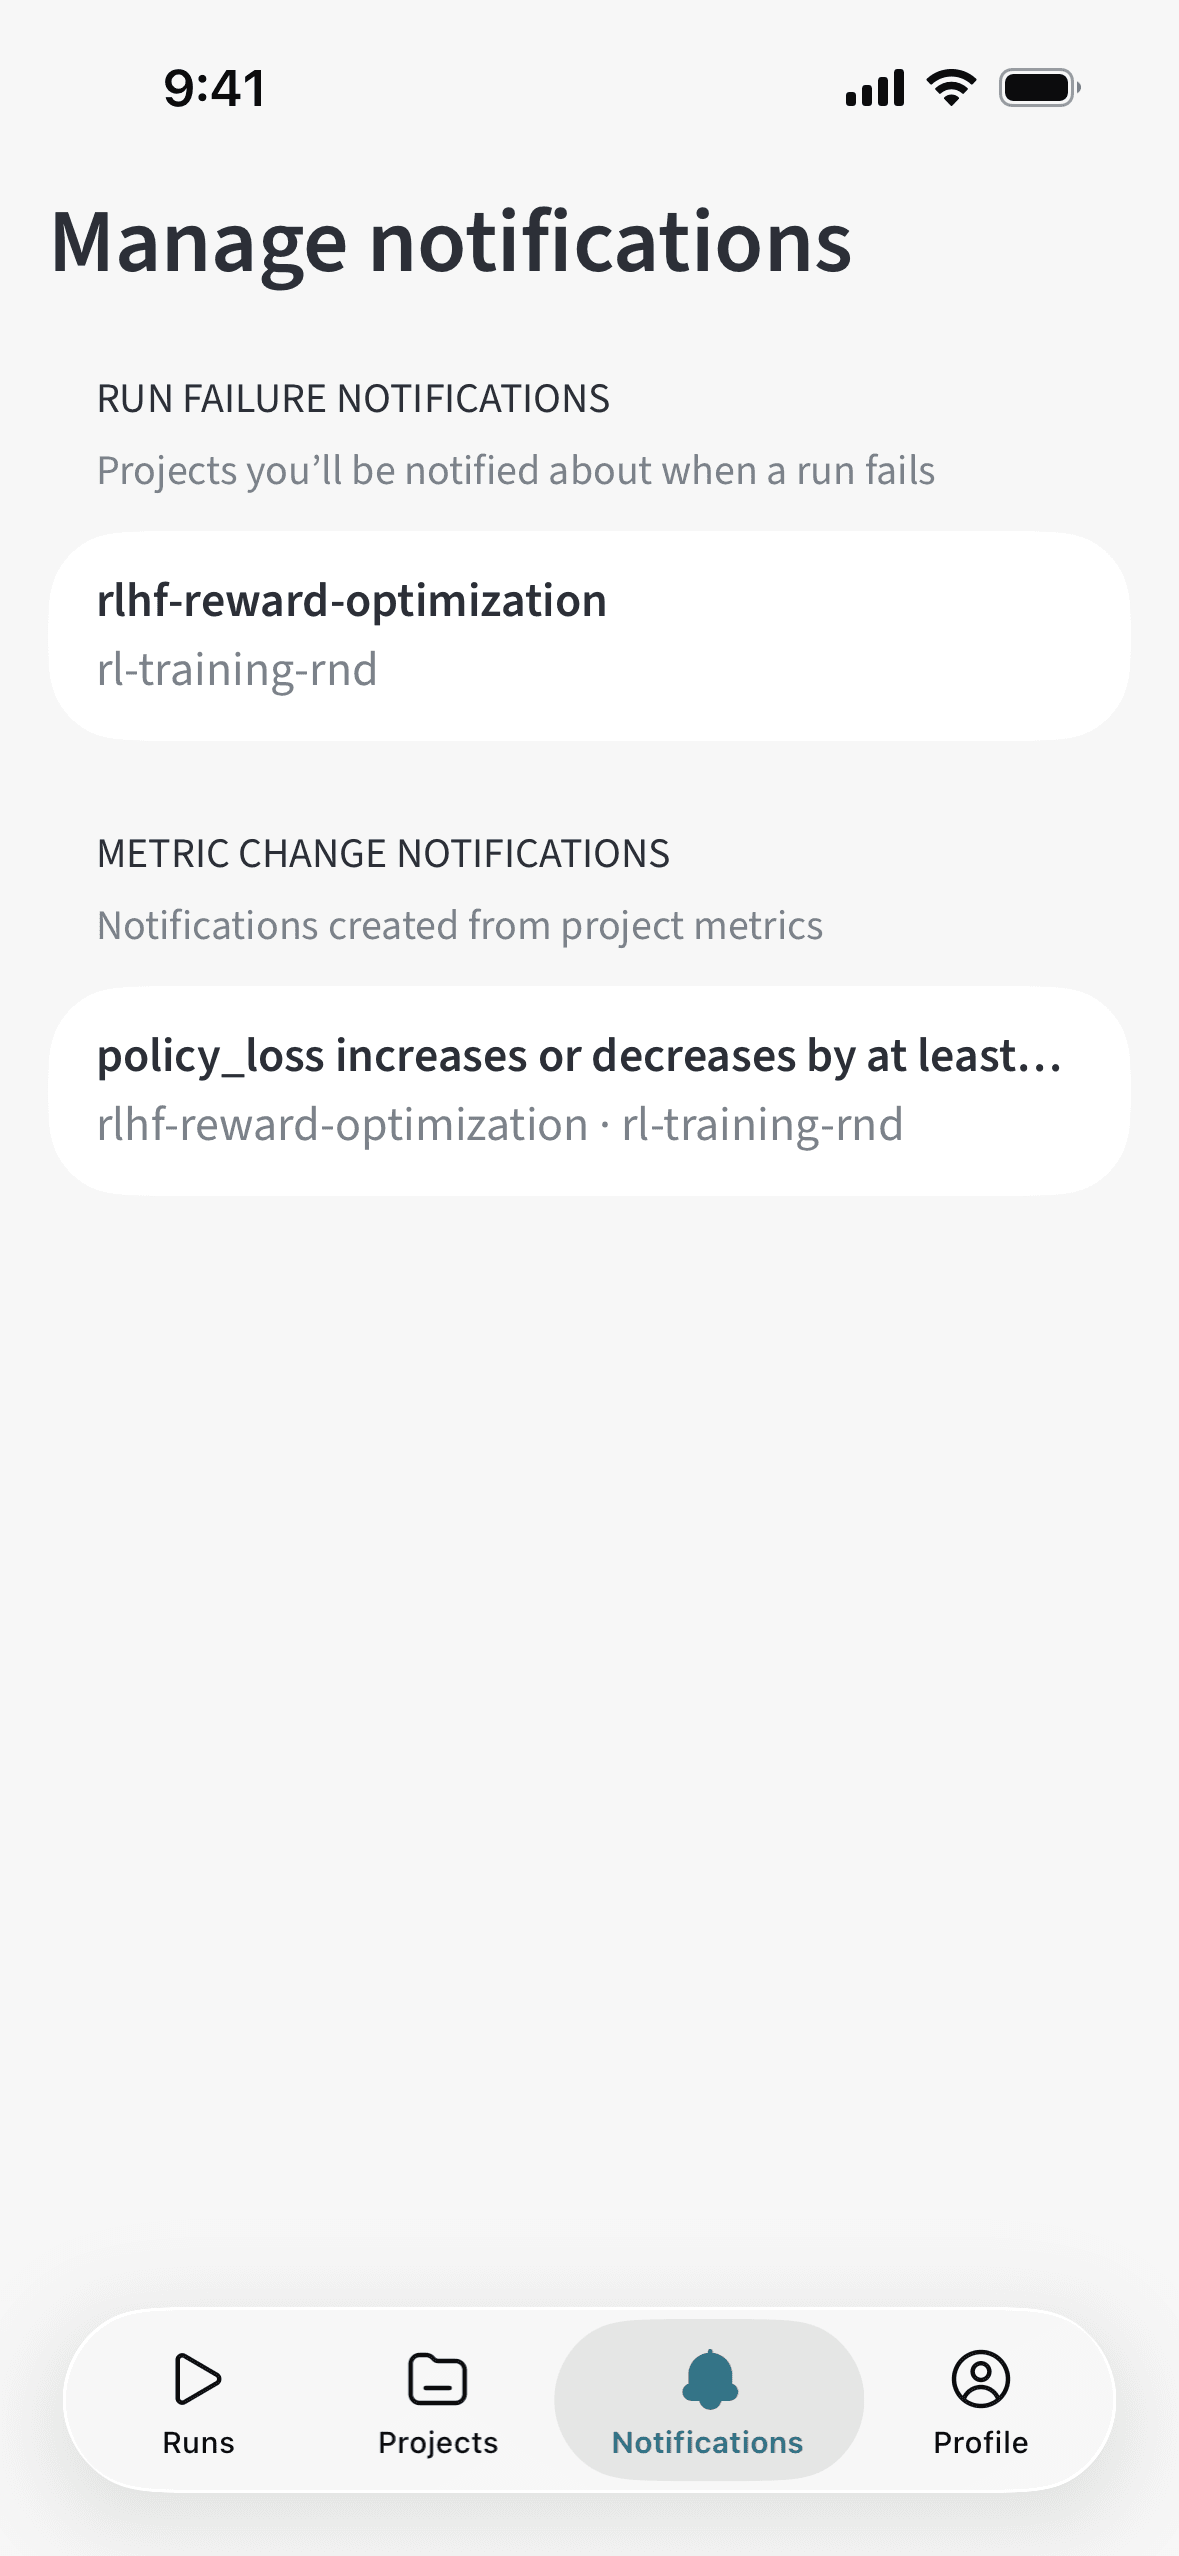 The following sections describe the kinds of notifications you can configure. The **Manage notifications** screen lists both kinds of settings in one place, with short descriptions that explain what each section controls.
### Metric threshold alerts
Use metric threshold alerts to get notified when a metric crosses a value you specify.
1. Navigate to a run.
2. Tap the graph to enter full screen view.
3. Tap the bell icon in the top right.
4. Set notifications that trigger when future runs cross the specified metric threshold.
### Run failure alerts
Use run failure alerts to get notified when runs in a project fail.
1. Navigate to a project.
2. Tap the **action ()** menu in the top right.
3. Select **Run failed alert** to receive notifications for future run failures in that project.
The following sections describe the kinds of notifications you can configure. The **Manage notifications** screen lists both kinds of settings in one place, with short descriptions that explain what each section controls.
### Metric threshold alerts
Use metric threshold alerts to get notified when a metric crosses a value you specify.
1. Navigate to a run.
2. Tap the graph to enter full screen view.
3. Tap the bell icon in the top right.
4. Set notifications that trigger when future runs cross the specified metric threshold.
### Run failure alerts
Use run failure alerts to get notified when runs in a project fail.
1. Navigate to a project.
2. Tap the **action ()** menu in the top right.
3. Select **Run failed alert** to receive notifications for future run failures in that project.