

.wandb transaction logs, so you can inspect runs before they sync to the cloud. You can also open a remote run by URL to view its scalar history and summary.
When to use LEET
LEET is built for engineers who spend most of their time in a terminal, especially on remote machines, clusters, or SSH sessions where a graphical browser is slow or unavailable.
LEET and W&B show the same underlying run data when that data exists locally and has been synced. LEET supports local run files, live updates from an active training process, and limited remote-run exploration.
Prerequisites
Install or upgrade the W&B CLI to the latest release usingpip or uv:
- pip
- uv
In SDK v0.27.x and earlier, launch the LEET TUI with
wandb beta leet instead of wandb leet.Launch LEET
From the directory that contains yourwandb/ folder, open the default workspace and auto-select the latest local run:
PATH that points to a workspace directory, a specific run directory, or a .wandb file:
wandb leet in the CLI reference.
Remote runs
To view a synced run, pass its URL. Replace[ENTITY], [PROJECT], and [RUN-ID] with the values from your run URL:
Views and pane layout
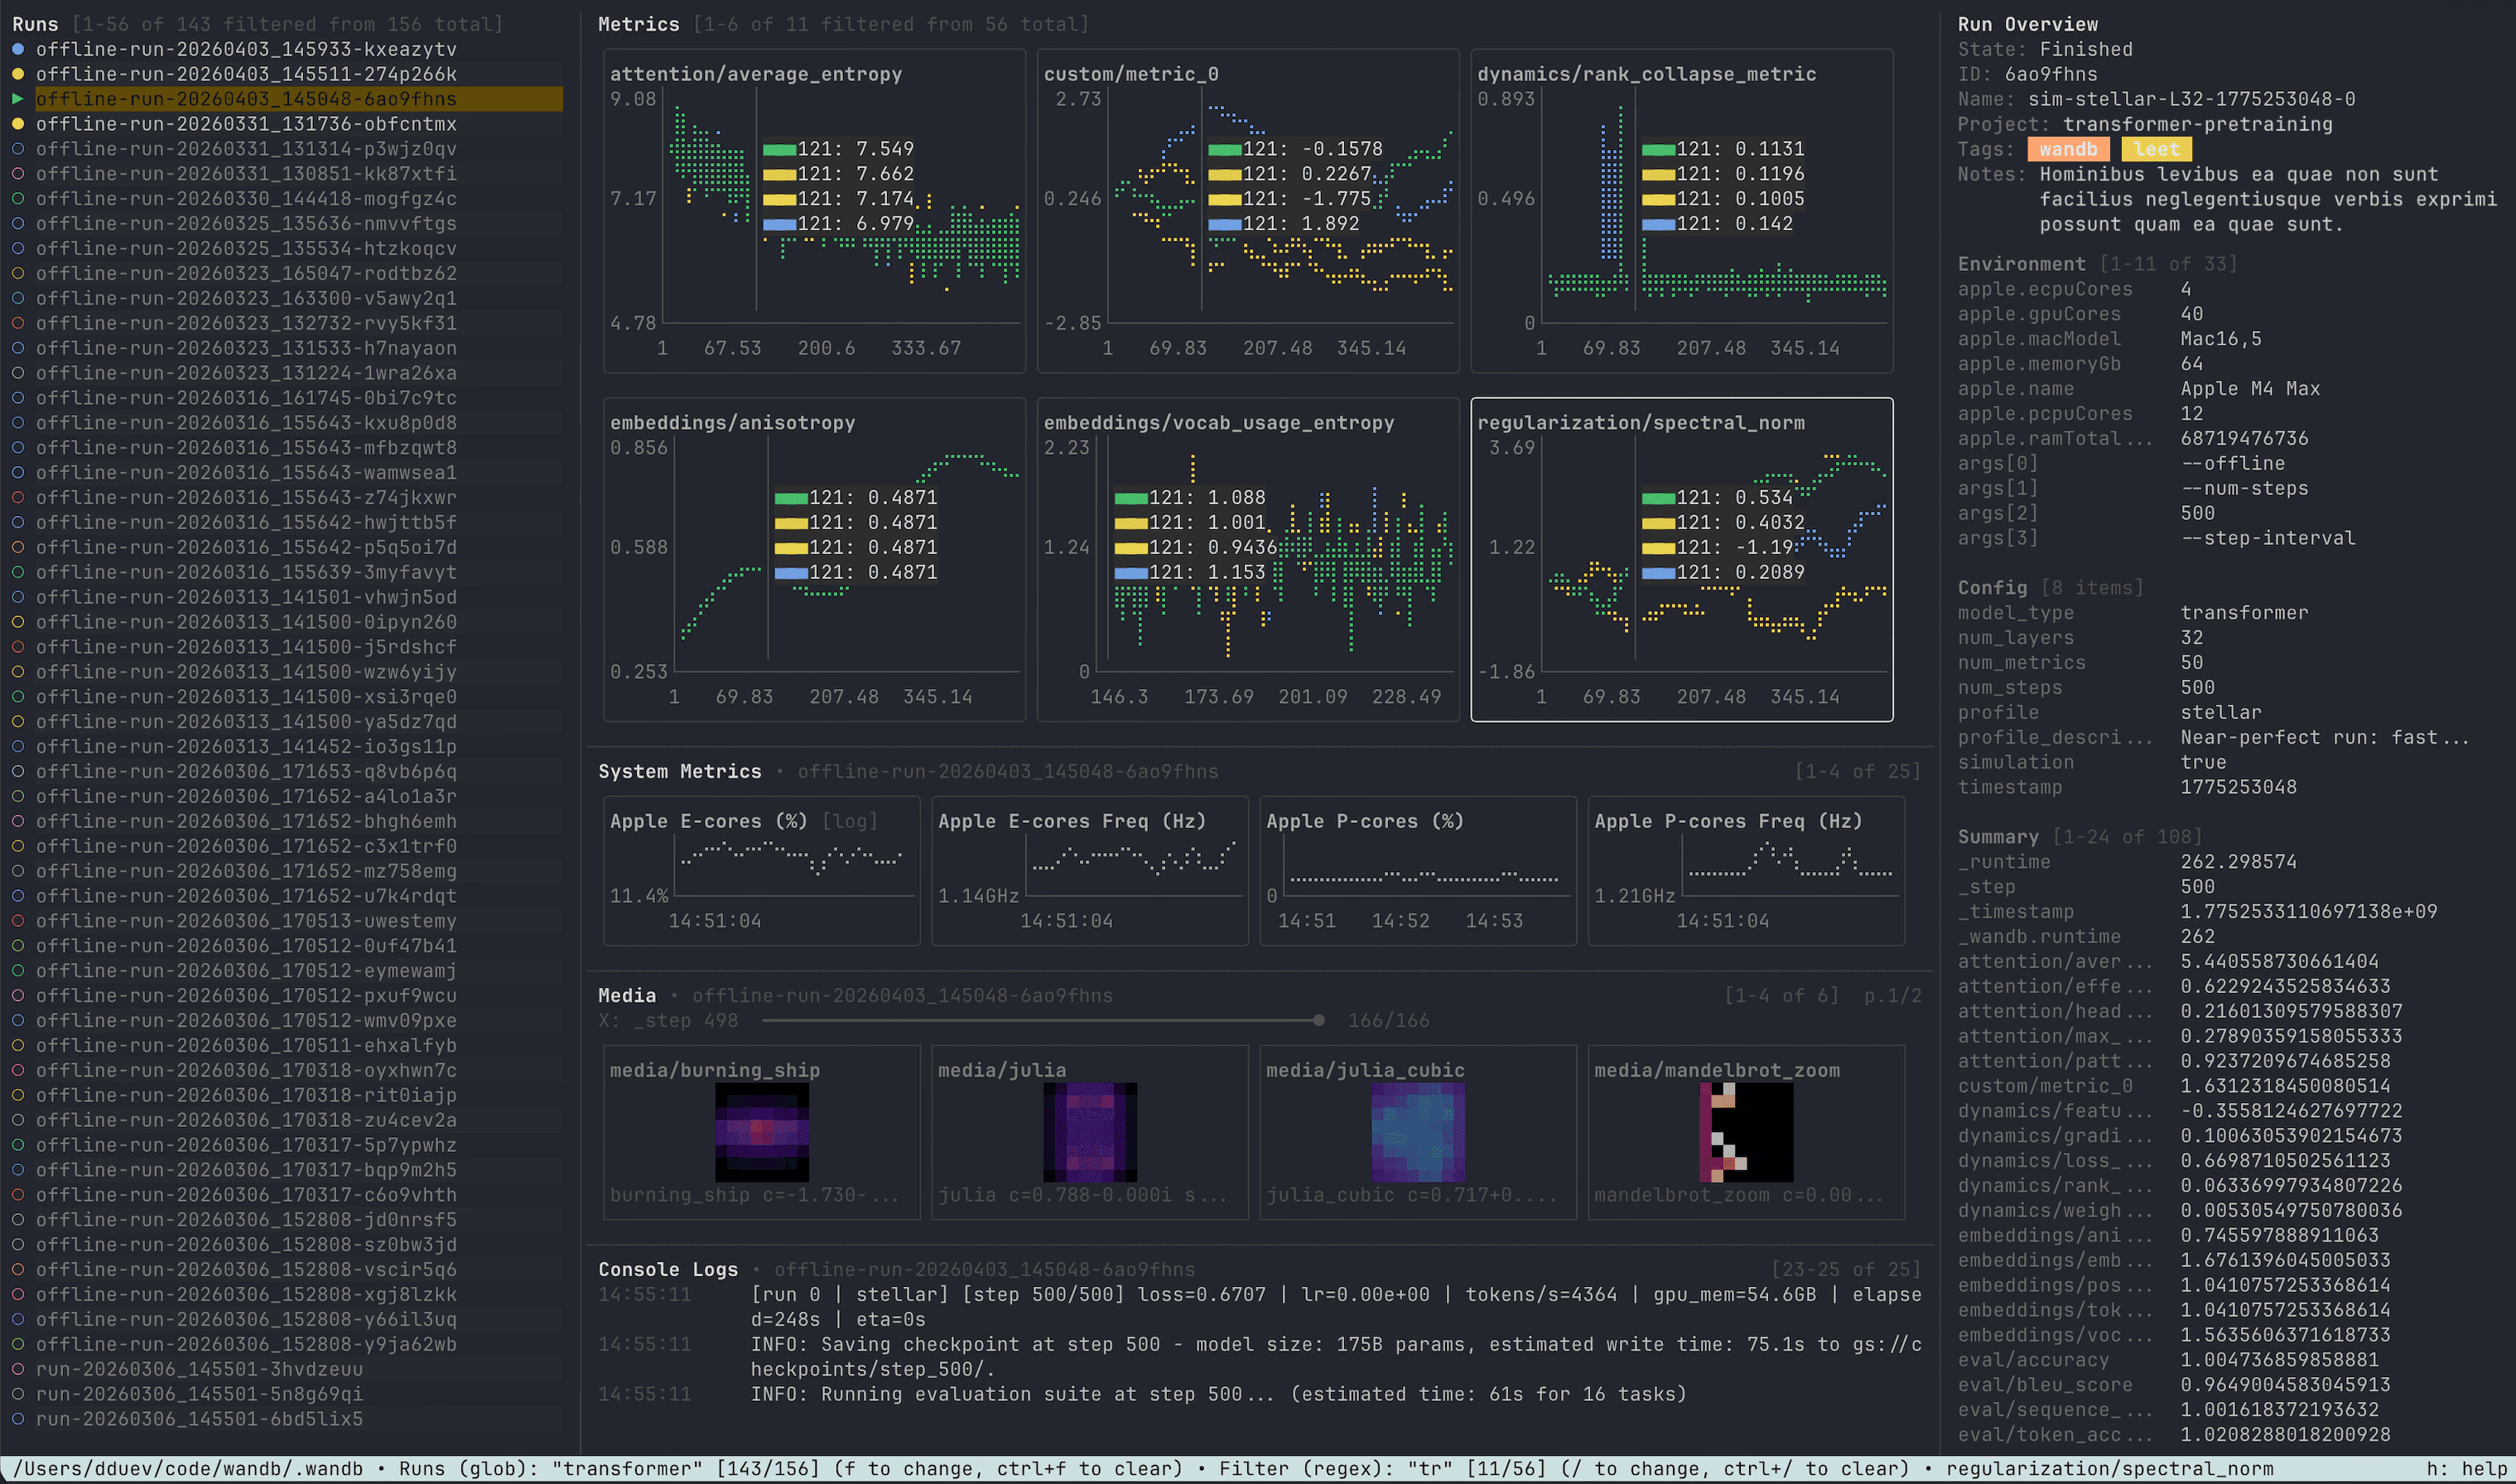
LEET has three main views: workspace, single-run, and SYMON. The record inspector provides a separate view of a local transaction log.Workspace view
Workspace view is the default. It is designed to compare multiple runs from the same localwandb/ directory.
Typical panes include:
- Runs sidebar — browse and filter local run folders.
- Metrics grid — overlay selected runs on the same scalar charts.
- System metrics — charts for the highlighted run.
- Media —
wandb.Imagethumbnails rendered in the terminal. - Console logs — assembled stdout and stderr for the highlighted run.
- Run overview — state, IDs, tags, notes, config, and summary values.
space to select or deselect a run for overlaid metrics. Selected runs have a filled icon. Use p to pin a run so its series stays on top in metric charts. Press enter on the highlighted run to open single-run view. Live runs keep updating in the workspace, so you can use LEET for both post-run analysis and monitoring an active job.
Live runs have animated markers in the runs list and a pulsing state indicator in the status bar. LEET marks a live local run as crashed after 10 minutes without transaction-log updates. If writes resume, LEET resumes live monitoring.
In narrow terminals, LEET temporarily hides the run overview sidebar, then the runs sidebar, to leave at least 24 columns for charts when possible. The sidebars return when the terminal has enough space.
Single-run view
Single-run view focuses on one run with a metrics grid in the center, run overview on the left, and system metrics on the right. Media and console log panes open below the metrics grid when toggled on.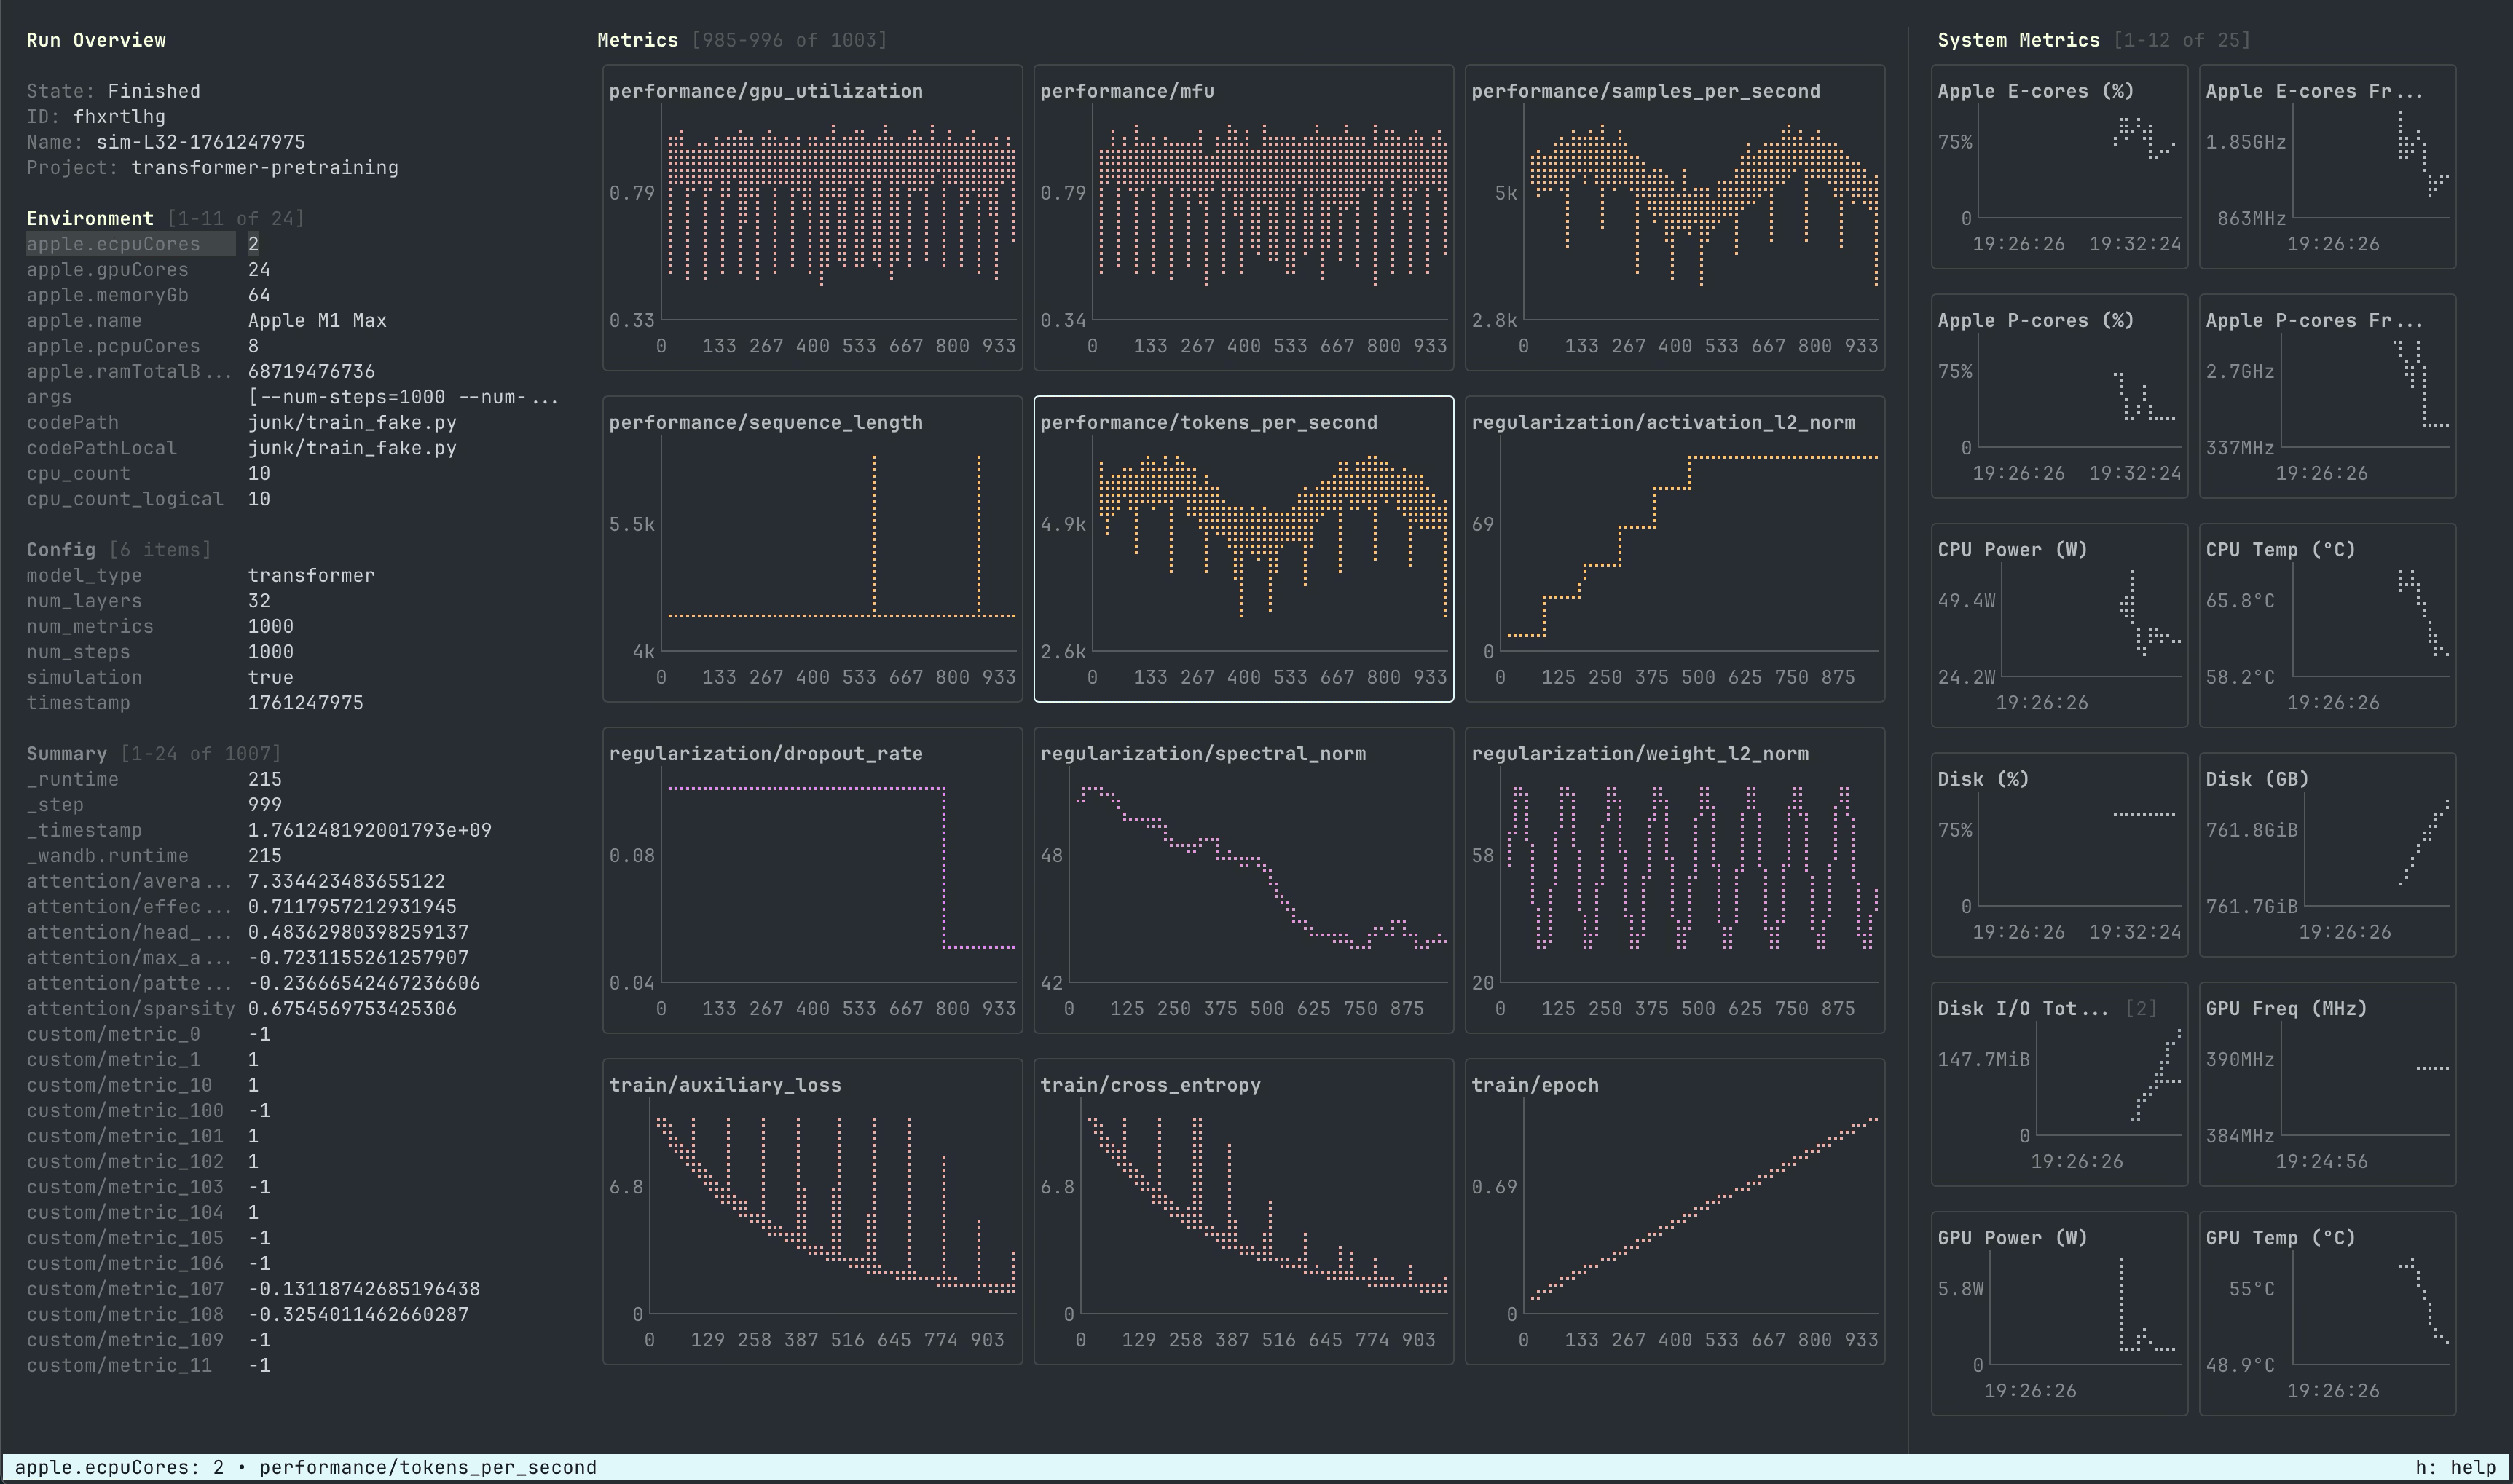
esc to leave the active filter or fullscreen media view, then clear pane focus. For a local run, press esc again with no pane focused to return to workspace view.
SYMON
SYMON watches local CPU, memory, disk, network, and accelerator metrics. It uses the same chart engine as run-backed system metrics panes but is not tied to a W&B run file.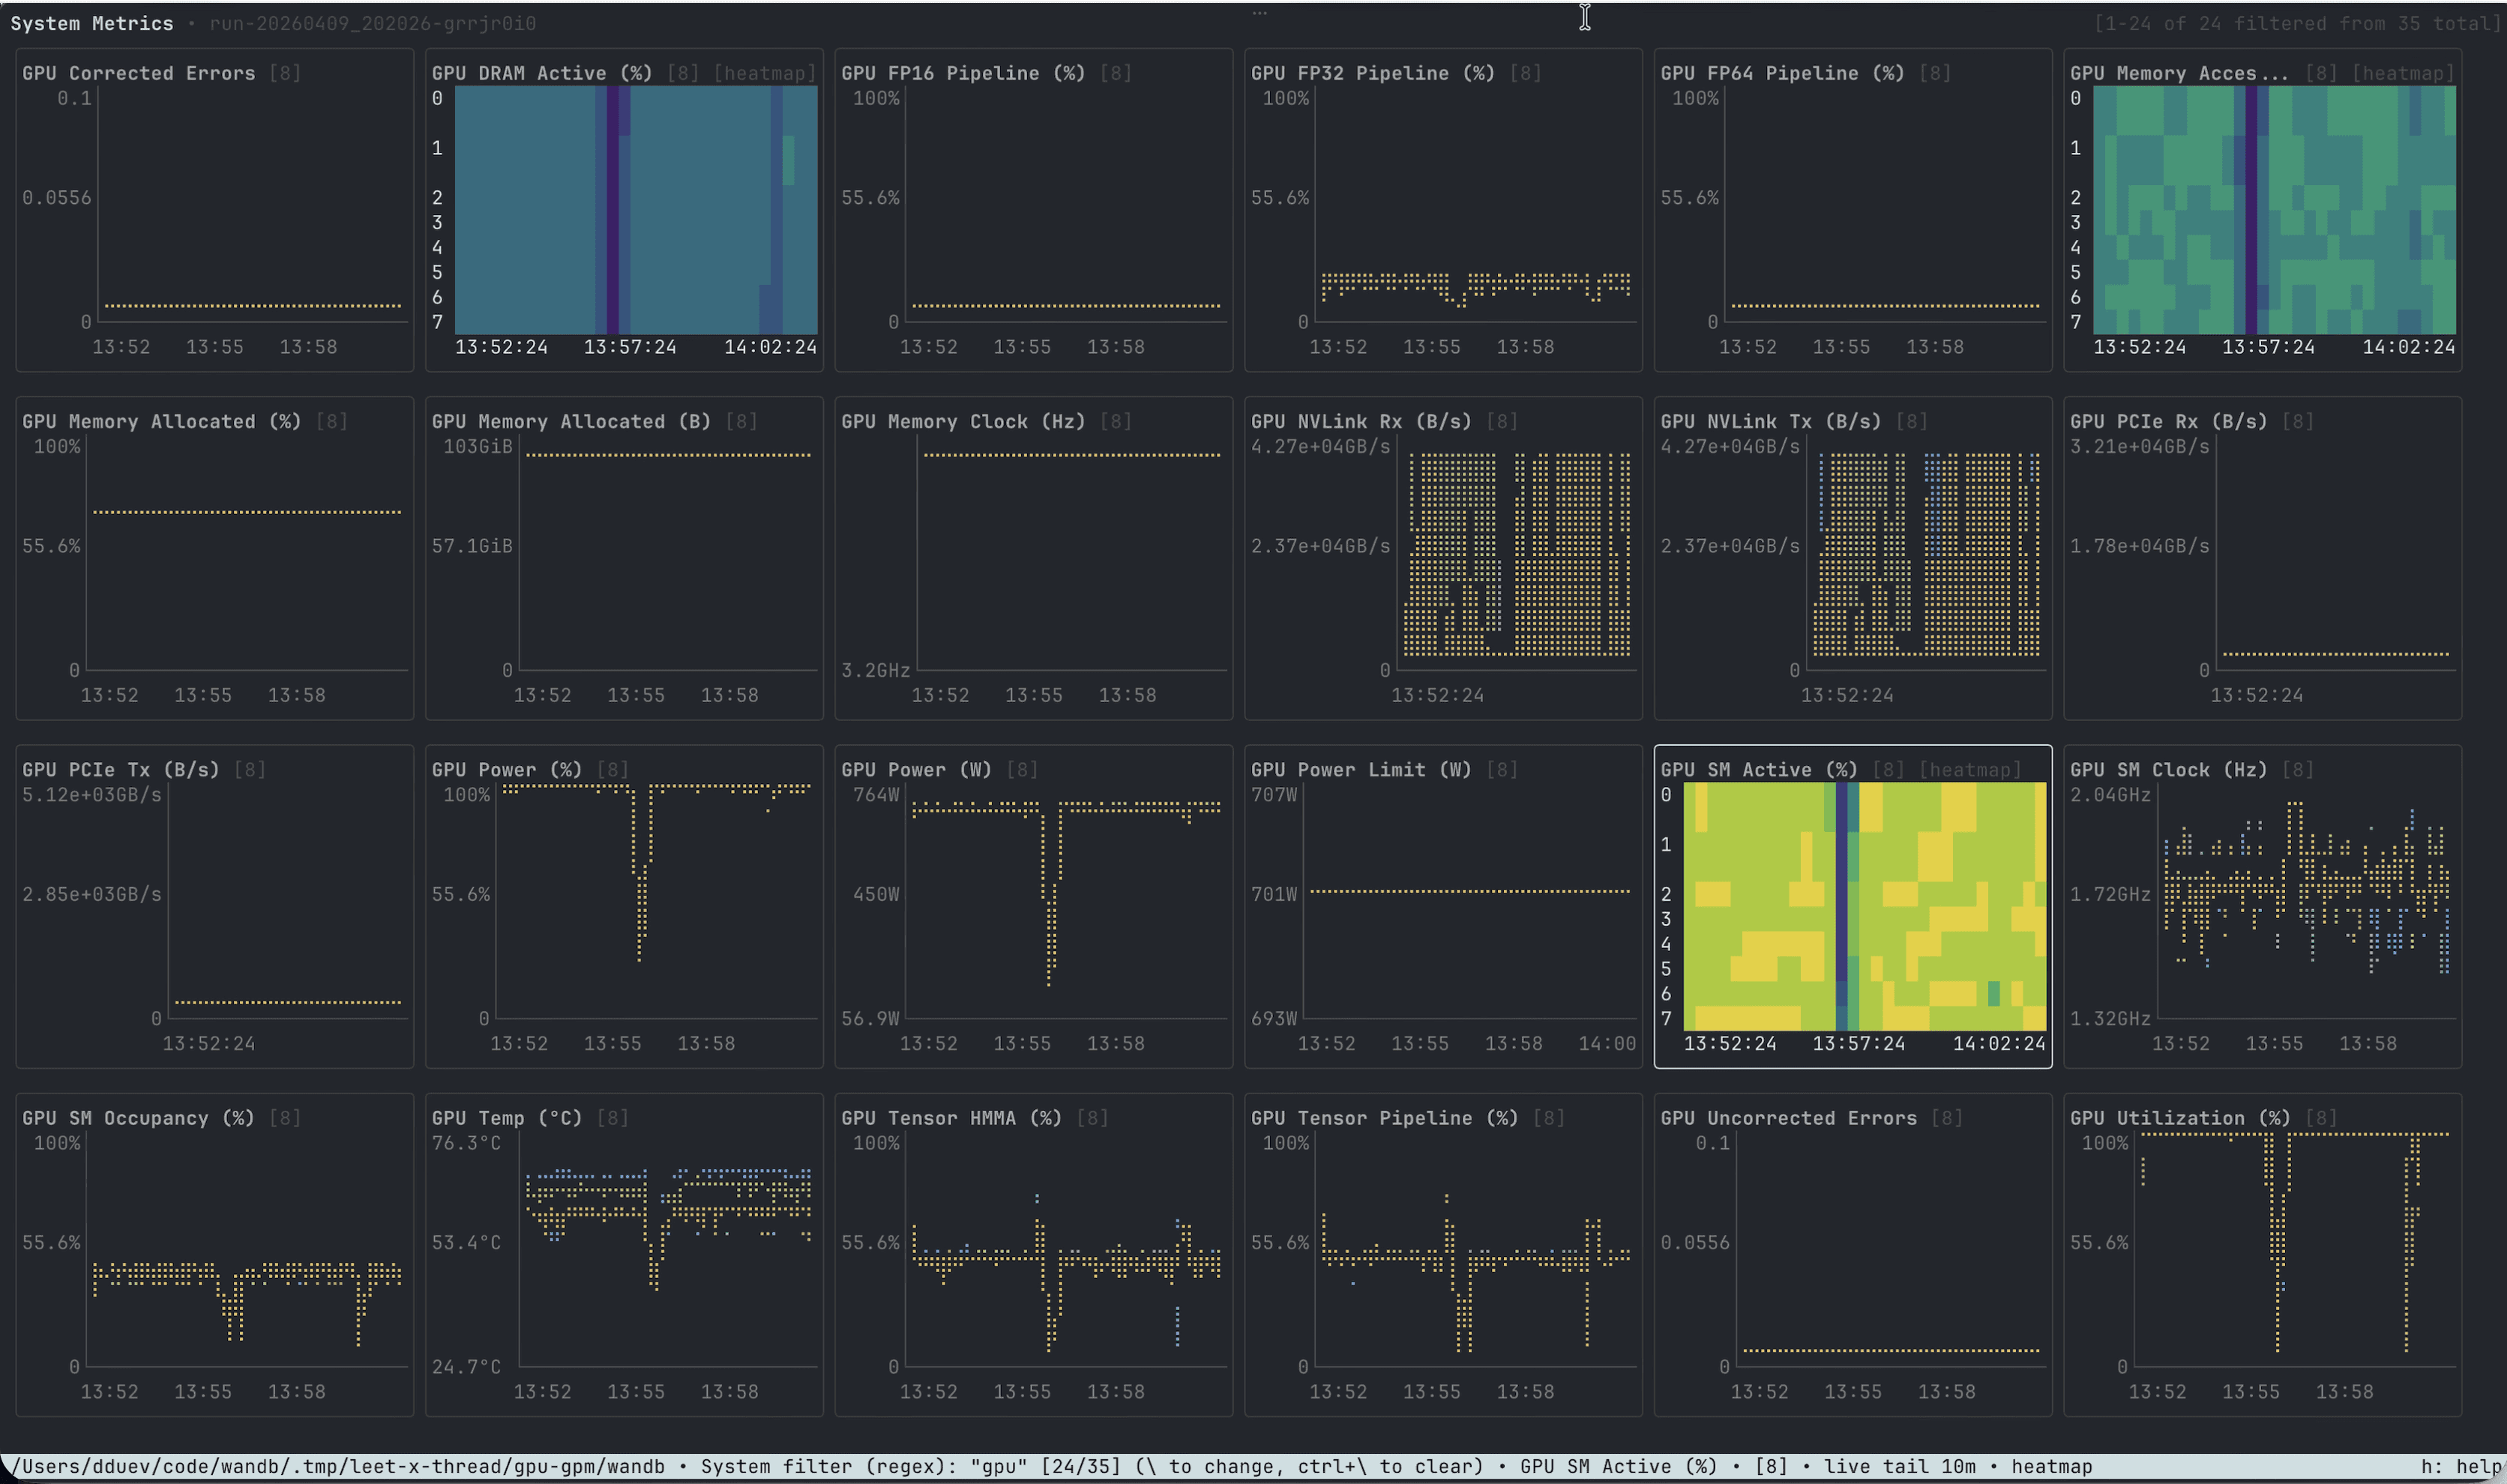
Record inspector
Use the record inspector to examine the raw records in a local.wandb transaction log. In single-run view, press i to open it for the current run. You can also launch it directly:
.wandb file, a run directory, or a workspace directory. With no path or a workspace directory, LEET opens the latest run.
The record list shows record types and summaries alongside the selected record’s full text. Press / to filter by type or summary, tab to switch between regex and glob modes while editing, and ctrl+/ to clear the filter. With the record list focused, press end to follow new records from a live run. If you opened the inspector with i, press esc from the record list to return to the run.
When stdout is piped or redirected, the command prints the available records as Protocol Buffer text and exits:
Key features
Multi-run comparison
Select multiple runs in workspace view to compare scalar metrics on shared charts. Each run gets a stable color, and LEET reduces base color collisions so overlaid series stay distinguishable. Pinning is useful when many runs are selected and you want one series to render above the rest. Pressf to filter the runs list by name, project, tags, notes, config values, and other metadata. Bare terms search across run key, display name, run ID, project, tags, and notes. The filter also supports fielded queries:
Supported operators are
:, =, !=, >, >=, <, and <=. Numeric comparisons are useful for config values such as learning rate, batch size, or number of layers.
Use whitespace or AND for conjunction, OR or | for alternatives, and -, !, or NOT for negation. Use quotes for phrases with spaces.
tab to switch between regex and glob modes. Regex mode behaves like a case-insensitive substring search unless the query contains regex metacharacters. Glob mode supports * for any sequence and ? for any single character.
LEET saves run, metric, and system metric filters, including their match modes, in .wandb-leet.json inside each local wandb/ directory. It restores them when you reopen that directory in workspace or single-run view. Clearing a filter also clears its saved value. Console log and run overview filters aren’t saved between sessions.
Metrics and system metrics
LEET renders scalar metrics as terminal line charts. Filter run metrics with/ and system metrics with \. When the console logs pane has focus, / filters logs instead. Press y on a focused chart to cycle modes such as log-scale Y or bucketed heatmap views for percentage-based system metrics.
Press g to cycle chart guides between off, a dotted background, and horizontal lines aligned with Y-axis ticks. This setting applies across workspace, single-run, and SYMON views and is saved between sessions.
By default, LEET plots each metric against W&B’s internal step metric (_step). For local runs, a custom X-axis defined with run.define_metric() takes precedence, including definitions that use glob patterns. For example, this run plots train/loss against train/step:
[x: train/step]. Rows without a finite value for the custom X-axis are omitted. Each chart uses one X-axis, so compare runs with the same axis definition. A custom axis replaces the default step axis, and series using a different axis aren’t plotted on that chart.
Use the mouse wheel to zoom the focused chart. On live system metric charts, LEET defaults to a rolling tail window (10 minutes by default). Right-click and drag on a chart to inspect the nearest point. Hold alt while dragging to inspect visible charts in the same grid at the same X position. Metric charts synchronize only when they share the same X-axis.
Media and console logs
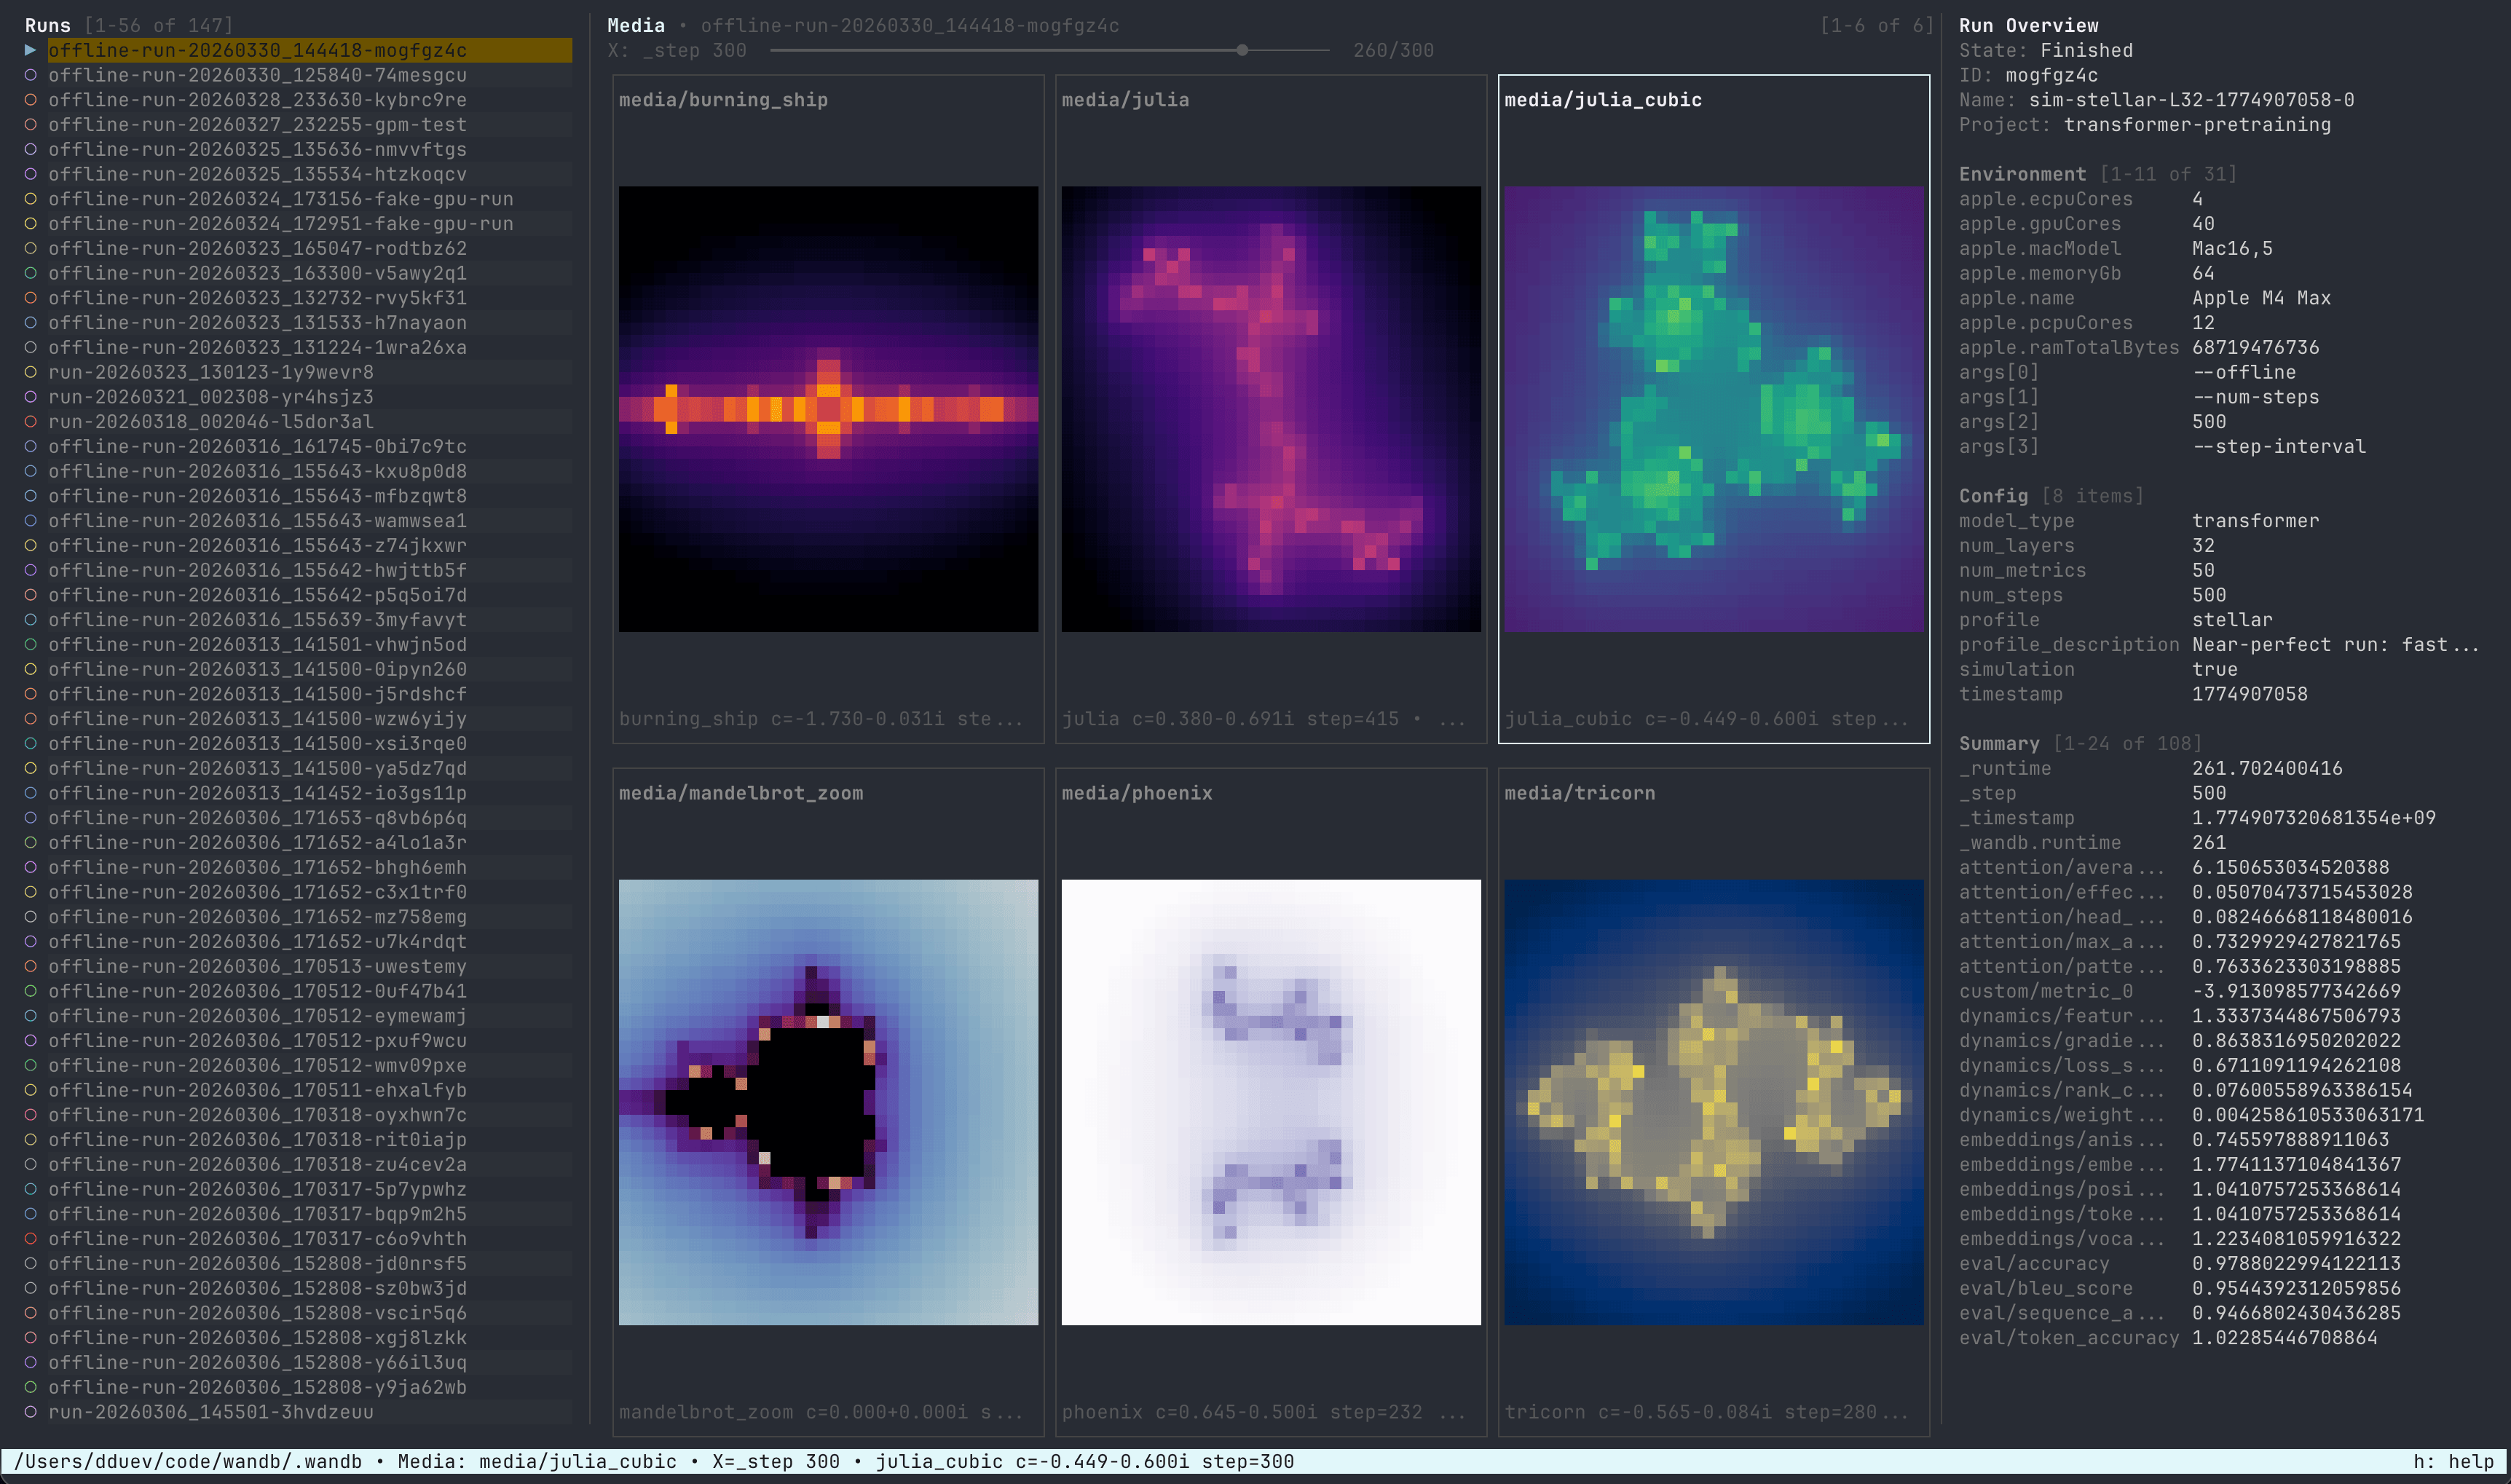
The media pane showswandb.Image series, including lists of images logged under one key, with one tile per image. Toggle it with 3 in workspace or single-run view.
With the media pane focused, use w, a, s, and d to select tiles. The left and right arrows move one frame, and the up and down arrows move 10 frames. Press enter for fullscreen media and esc to leave it. Press l to link scrubbing across image series so the arrows, home, and end move a shared cursor along their combined step timeline.
Press k to switch between ANSI thumbnails and high-resolution rendering in terminals that support the Kitty graphics protocol. LEET falls back to ANSI when the terminal doesn’t support high-resolution rendering. Image padding uses the terminal background.
4. LEET rebuilds readable log lines from raw terminal output, including ANSI escape codes and carriage-return progress lines.
To filter console output, focus the logs pane, press /, and type a pattern. Press tab while editing to switch between regex and glob matching. Press enter to apply the filter or esc to discard the draft query. LEET displays matching lines and follows new matches when you’re at the end of the log. With the logs pane focused, press ctrl+/ or ctrl+l to clear the filter.
For console log behavior in the W&B App, see Console logs.
Configuration
Persist layout, colors, default panes, and startup mode with the config editor:wandb-leet.json under ~/.config/wandb/ by default, or under WANDB_CONFIG_DIR when that variable is set. You can also resize grids from inside LEET with c and r.
Drag pane borders and separator lines to resize sidebars, stacked panes, and the Environment, Config, and Summary sections of the run overview. The active border is highlighted while you drag. LEET saves the proportions separately for workspace, single-run, and inspector views. Press 0 to reset sizes for the current view, including the run overview sections.
In the config editor, the field list scrolls with your selection to fit short terminals. Press space to toggle a boolean setting.
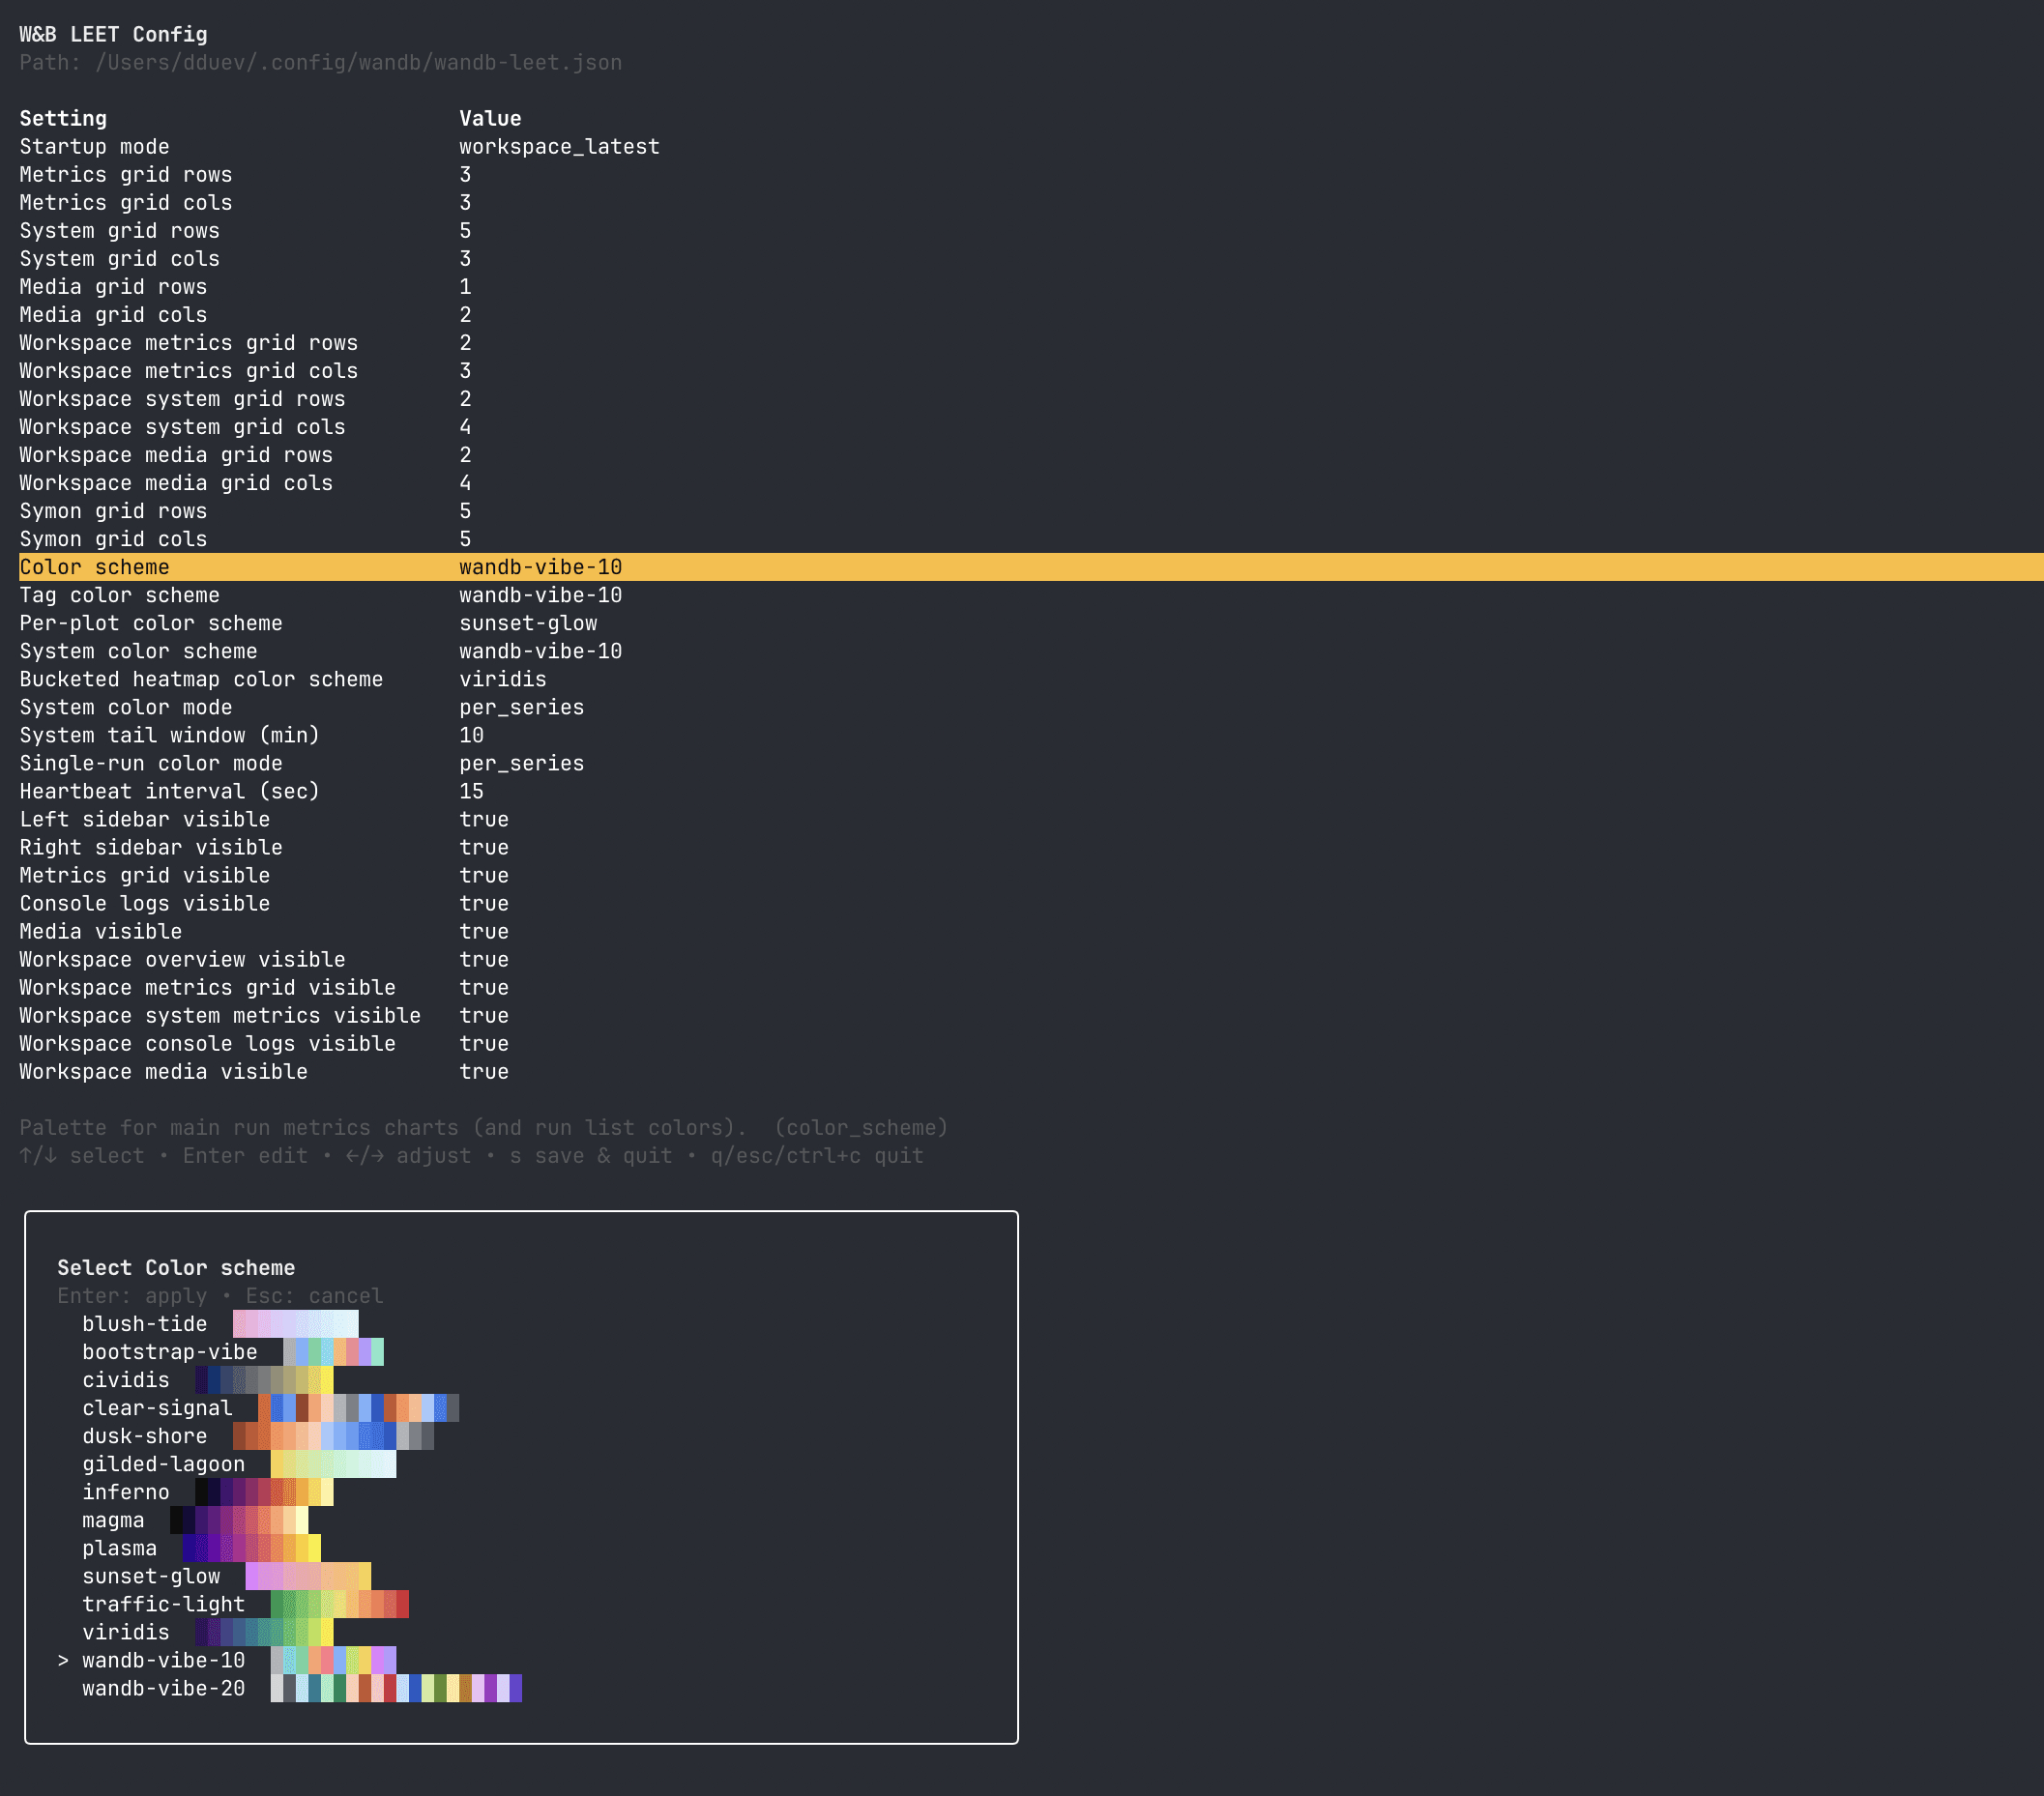
Common config keys
Several color schemes are available, like
wandb-vibe-10, wandb-vibe-20, sunset-glow, blush-tide, gilded-lagoon, bootstrap-vibe, dusk-shore, clear-signal, traffic-light, viridis, plasma, inferno, magma, and cividis.
- Palettes
dusk-shoreandclear-signalare colorblind-friendly. - Sequential palettes such as
viridis,plasma,inferno,magma,cividis, andtraffic-lightwork well for bucketed heatmaps.
Diagnostics and telemetry
LEET prints startup failures to stderr. To collect debug logs, launch it withWANDB_DEBUG=true:
wandb-leet.debug.log beside the global wandb-leet.json config file. LEET doesn’t send usage telemetry when WANDB_MODE=offline, WANDB_MODE=disabled, or WANDB_ERROR_REPORTING=false.
Navigate with the keyboard
LEET is designed for keyboard and mouse input. Pressh or ? inside LEET to open the in-app help overlay for the current view.
Across workspace and single-run views:
tabandshift+tabcycle focus between visible panes.w,a,s,dand the arrow keys move within the focused pane (except in the media pane, where arrows scrub the X-axis and WASD moves between tiles).home,end,pgup, andpgdownjump within lists, chart pages, or media frames.1,2,3, and4toggle the metrics grid, system metrics, media, and console logs panes.[and]toggle sidebars (runs list, run overview, or system metrics depending on the view).
Limitations compared to the W&B App
LEET complements the W&B App but does not replicate every workspace capability.
If you need artifacts, sweep analysis, or panel types that LEET does not provide, open the run in the W&B App after syncing.
Changelog
LEET was initially launched in beta in SDK v0.23.0, and graduated to GA in SDK v0.28.0. For details, refer to the SDK release notes.Related resources
- View a specific run in the W&B App or LEET.
- Keyboard shortcuts for the W&B App and LEET.
wandb leetcommand reference.- SDK release notes, including LEET changes.